Elasticity-Aware Tier Breakpoints in Usage Rate Cards
Tier breakpoints should align with where customer behavior shifts, not where spreadsheets round off.

Rate cards fail quietly. A tier boundary set at a round figure, one million API calls, five hundred seats, looks precise, but round numbers are a convention, not a measurement. The real question, where does customer behavior actually change as consumption rises, has an answer sitting in usage logs and churn timestamps, and most vendors never go looking for it. This piece is about finding that answer and placing breakpoints where demand itself bends, not where a spreadsheet happens to round off. Get this wrong and the cost isn't cosmetic: it appears in the net revenue retention number, months later, with no obvious cause attached.
The shift to consumption pricing and the urgency of breakpoint design
Usage-based pricing went from a minority practice to the default architecture of software pricing inside five years. Roughly 30% of SaaS companies used some form of consumption pricing in 2019; by 2024 that figure had climbed to around 85%, with about 38% of companies now treating a usage metric as the primary anchor for what customers pay. That's a mainstream shift across companies broadly, including but not limited to infrastructure vendors billing by the compute-second.
Seat-based pricing never had a breakpoint problem worth solving. Multiplying the price by headcount makes the revenue line write itself: no curve to bend, no inflection to hunt for. Consumption pricing replaces that flat multiplication with a spectrum, usage running from zero to whatever the workload demands, and somewhere along that spectrum, buyer behavior shifts. Below a certain volume, customers barely notice the meter. Above it, they start negotiating, downgrading, or building workarounds to dodge the next price step. A tier boundary drawn without reference to that shift is a guess wearing a decision's clothes. It's a guess wearing a decision's clothes, and most rate cards on the market today are exactly that guess, never revisited since launch.
Price elasticity in consumption-based pricing versus seat-based pricing
Classic price elasticity of demand measures the percentage change in quantity demanded against the percentage change in price, a market-level statistic that describes a whole product line at once. Usage rate cards need something narrower than that: elasticity at the margin, measured at the exact point where one customer crosses from one tier into the next.
Two signals appear at that margin, and they point in opposite directions. Compression means usage clusters just under a breakpoint, customers actively capping consumption to dodge the next tier's price. Expansion means usage accelerates faster than expected right after a customer crosses a threshold. The new tier removed a ceiling rather than imposing one. Both prove elasticity exists at that boundary. They call for different fixes, and treating them as interchangeable is how a rate card ends up correcting a problem it never had.
Reading elasticity signals in usage data before running a single experiment
Starting with a histogram of usage by customer, sorted by cohort, shows what piles up where. A visible spike just under an existing breakpoint is the cleanest compression signal there is: customers are watching the meter and stopping short on purpose. A gap just above that same breakpoint, almost nobody occupying the lower end of the next tier, says something different: the price jump outruns the value jump, so hardly anyone crosses voluntarily.
Churn timestamps carry a second signal. Plot cancellation events against usage level at the moment of cancellation, and churn will often bunch around one consumption band instead of spreading evenly. That band is pointing at the tier boundary nearest it. Run the mirror version for expansion: plot voluntary upgrades against usage level at the moment a customer chose to move up, and the consumption level that reliably precedes an upgrade is a strong candidate for where the breakpoint should actually sit.
Cohort aging closes the loop. Compare a customer's consumption in months three through six against months one and two, tier by tier. Fast, sustained growth toward a tier's ceiling in that window means the upper boundary was set too low for where this population is headed, and it needs revisiting well before renewal, not at renewal.
Experimental methods for confirming where the demand curve bends
Direct A/B testing, randomizing incoming customers across different tier structures and measuring conversion, consumption, and churn, is the most rigorous way to confirm a kink in the demand curve. It's also the least practical option for most companies. Billing-tier experiments need volume, and most vendors don't have a signup pipeline large enough to reach statistical significance on a tier-level test inside a useful timeframe. Waiting six months for a clean read on one breakpoint is its own kind of cost, and by the time the result lands, the underlying usage pattern may have already moved.
A few faster methods trade some rigor for speed, and each earns its keep in a different situation. Segment testing offers different tier structures to cohorts matched on firmographic and usage traits, controlling for the obvious confounders without full randomization. Geographic testing works when usage patterns are comparable across markets, letting a company try different breakpoints region by region without touching the whole customer base at once. Feature-level elasticity narrows the question further still: instead of measuring elasticity across an entire product, it isolates the one capability, often the compute-heavy or AI-intensive feature, that drives most of the cost and most of the perceived value.
The Van Westendorp Price Sensitivity Meter sits apart from the other three. It asks customers directly about their price perceptions, what feels too cheap, too expensive, and acceptable, and it's the only method on this list that doesn't need a single usage log to run. That makes it the right tool specifically when there's no usage history yet, a new tier structure on a new product, for instance, where every revealed-behavior method has nothing to chew on. Once usage data exists, though, Van Westendorp should step aside: it captures what customers say they'd pay, not what they actually do, and the gap between those two things is where a lot of pricing models go wrong.
Translating elasticity findings into specific breakpoint placement decisions
A compression signal and an expansion signal call for different fixes, and conflating them is the single most common design error in this exercise. When usage piles up below a threshold, the boundary is functioning as a penalty in the customer's mind, and the fix is either to lower the breakpoint to where customers already sit or to make the next tier's value obvious enough that crossing it feels like an upgrade instead of a toll. When usage accelerates after a threshold, the boundary is acting as a commitment device that unlocks spend, which is what a good breakpoint should do. Don't move that one. Check instead whether the tier above is priced to capture the accelerated consumption, or a second, higher breakpoint is now missing.
Treat it as a gap-and-cluster read. A cluster below a threshold means the threshold behaves like a ceiling, not a natural transition point, and belongs lower, or needs a redesigned value story to match it. A gap above a threshold means the price step outsizes the value step, and the fix is a smaller jump or an intermediate tier to soften the landing. A roughly uniform distribution across a band means there's no elasticity signal at that boundary at all, and the right question stops being where to move it and starts being whether that band is wide enough to matter to anyone.
None of this happens apart from cost. Elasticity analysis says where demand bends; the cost of goods sold at each tier says whether the business can actually afford to put a boundary there, and a breakpoint that ignores the second number is a breakpoint that erodes margin quietly. Packaging adds a constraint on top of the math. Research on pricing page conversion has found that three tiers convert best, that pages with four or more tiers convert roughly 31% worse, and research on choice overload found that too many options can cut purchase likelihood by as much as 40%. So even when elasticity analysis justifies four or five real thresholds inside the rate card, that granularity belongs in the overage math, not on the pricing page. Buyers still need to see three clean packages, no matter how many breakpoints sit beneath them.
How hybrid pricing structures change the breakpoint calculus
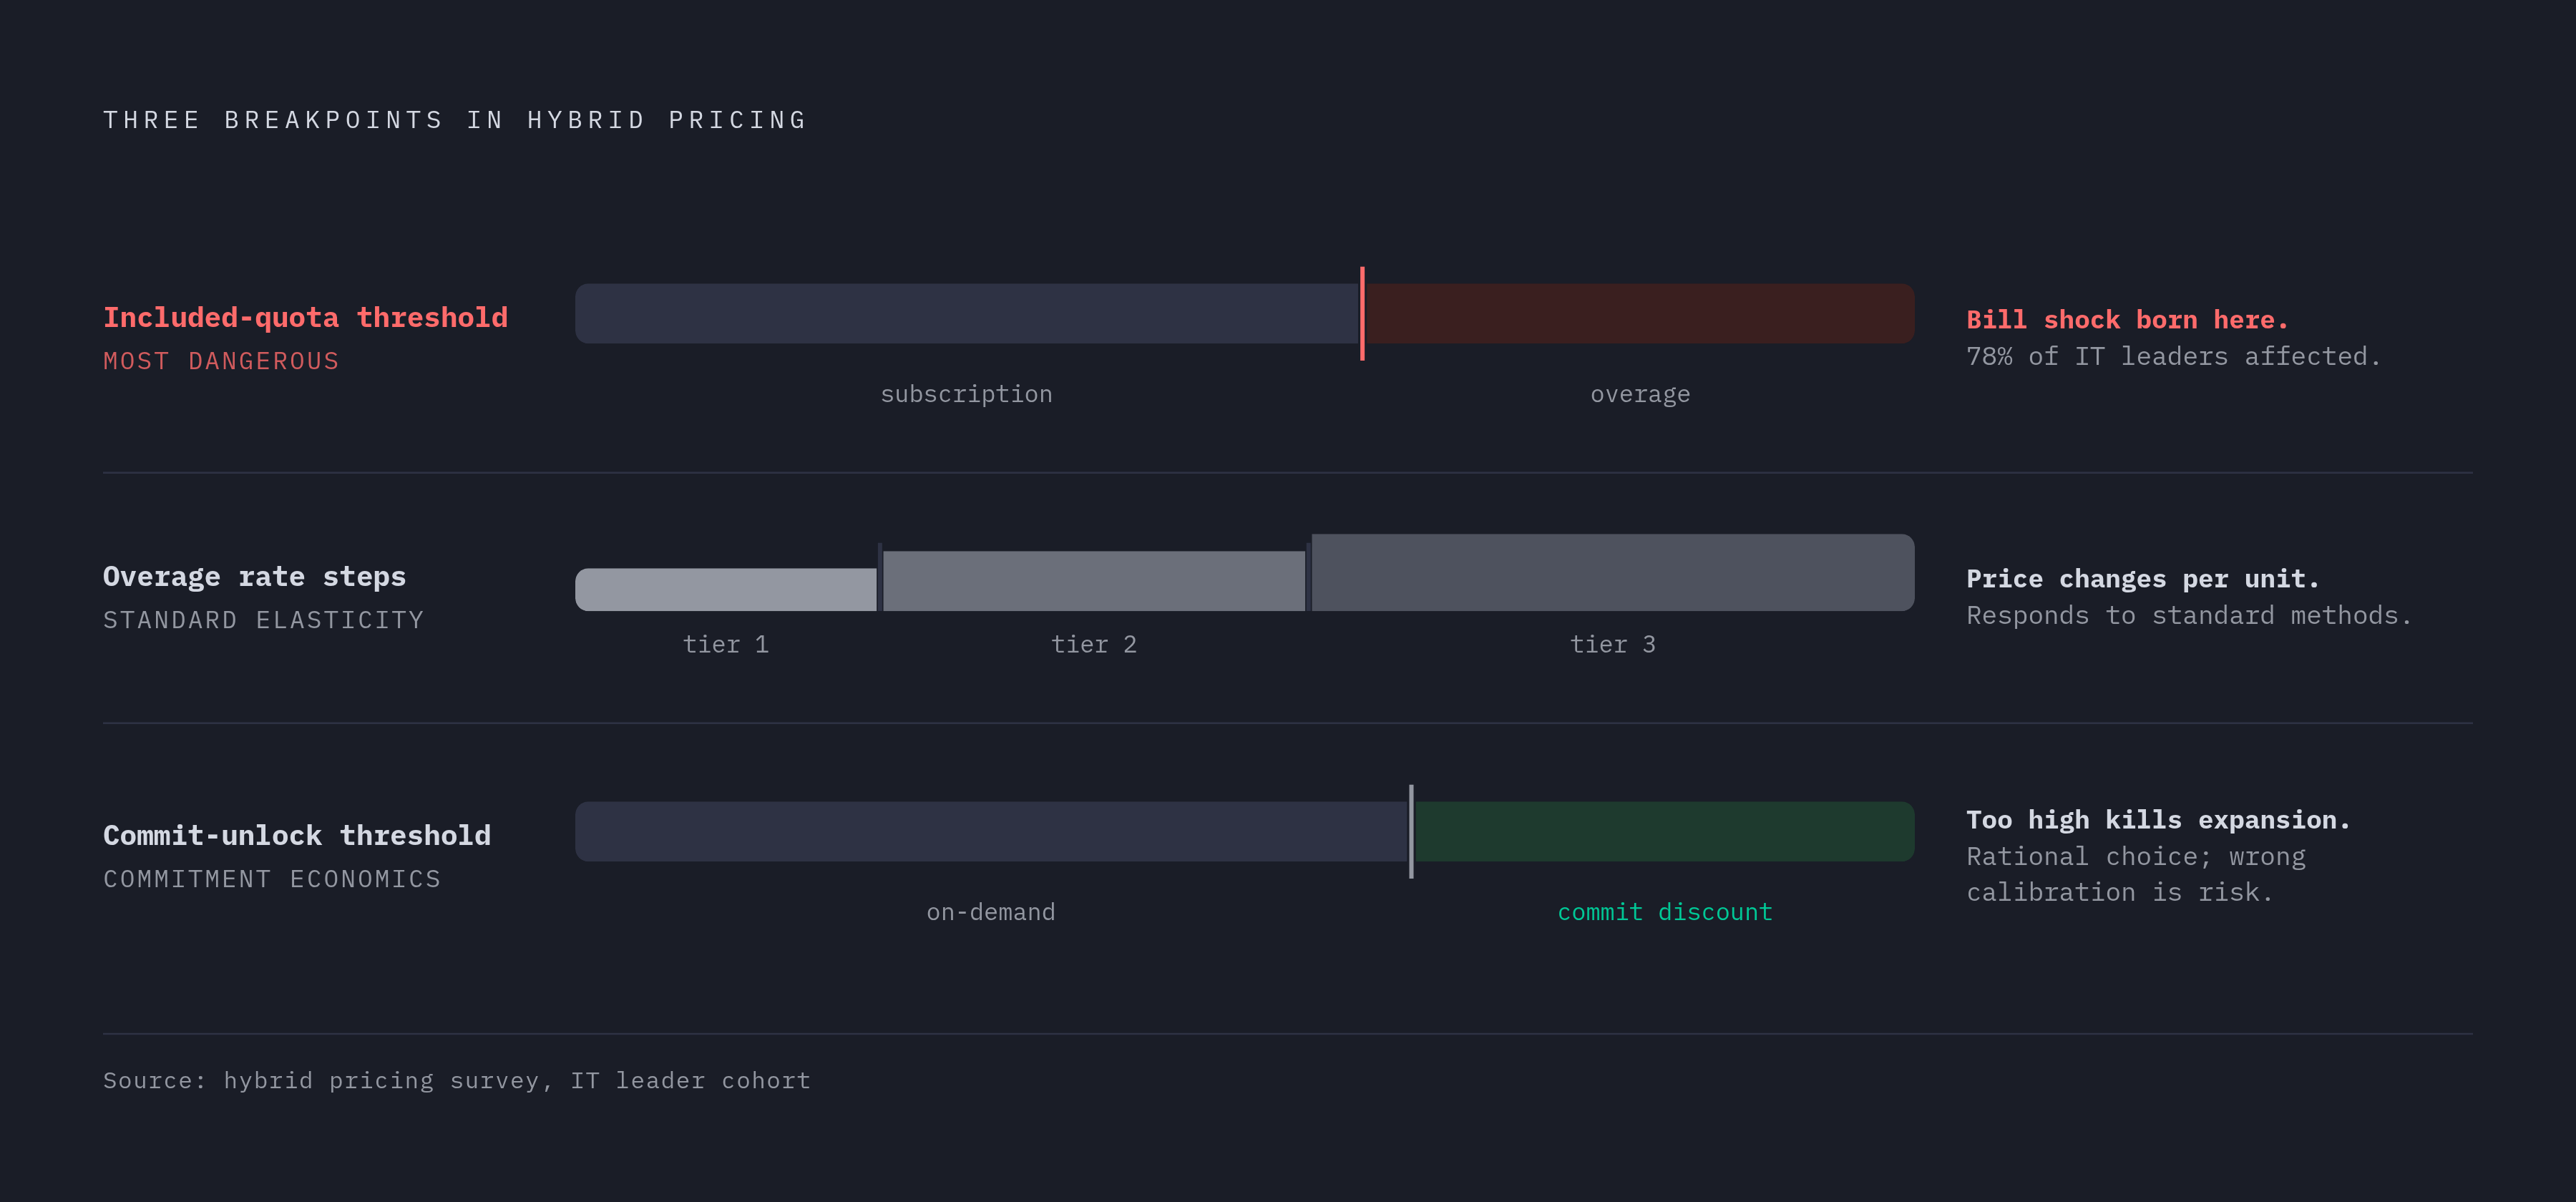
The pricing architecture that has actually held up is a hybrid. It's a hybrid: a subscription bundling a base tier of capability with an included usage quota, overage pricing beyond that quota, and optional volume commitments that lower the marginal rate for customers willing to pre-commit. That structure creates at least three separate breakpoints, not one, and they don't behave alike.
The included-quota threshold, where subscription usage runs out and overage billing kicks in, is the most behaviorally sensitive of the three. It's the first moment a customer feels metered at all, and it's where bill shock is born: 78% of IT leaders report unexpected charges tied to consumption-based pricing models. That threshold needs to sit where the median customer on that plan actually lands, not wherever finance would prefer the overage trigger for margin reasons. The overage rate steps, the points within the metered range where the per-unit price itself changes, are ordinary tier breakpoints and respond to the same elasticity methods covered above. The commit-unlock threshold, the usage level at which a volume commitment becomes the rational economic choice for the buyer, carries a different risk entirely: set it too high, and the expansion revenue that commitment was supposed to capture never materializes.
Credit-based pricing just changes the unit. It just changes the unit. When usage gets abstracted into a pool of credits instead of raw units like API calls or tokens, breakpoints govern the size of credit bundles rather than consumption thresholds directly, but the elasticity logic carries over unchanged. Credit depletion rate matters more here than raw usage volume, since depletion rate is what tells you whether a bundle size is actually calibrated to how customers burn through it.
Signals that a rate card's breakpoints have drifted out of calibration
Breakpoints don't fail loudly. They drift, as customers mature, as the product ships new capability that changes what a unit of usage is worth, and as underlying costs, inference costs especially, fall over time. A boundary calibrated correctly in the first quarter can be systematically wrong by the fourth, with no single event marking the moment it broke.
Net revenue retention slipping below 100% is the broadest of the operational tells to watch on a standing basis: it means the pricing model has stopped capturing expansion, and misplaced breakpoints that fail to build upgrade pressure are among the likeliest structural causes. Overage revenue shrinking as a share of the total suggests either the included quota has gotten too generous or the customer base has learned to self-limit under it. Support tickets clustering around billing surprises at a specific consumption level are direct evidence that a breakpoint caught customers off guard, a design failure, not something a support script can talk someone out of. A flattening tier-upgrade rate in the six-to-twelve-month window means the expansion breakpoints have stopped creating real pull. Churned accounts with above-median usage at the time they left are a signal that the top tier isn't delivering value proportional to what it costs, and that's often the most expensive kind of churn to lose, and the easiest to miss inside an aggregate churn number.
The companies that catch drift early look for it on a schedule instead of waiting for a metric to break. Roughly 60% of high-growth companies review pricing quarterly, and companies that optimize pricing on a regular cadence grow about 25% faster than those running static pricing. Only about 24% of companies run pricing experiments on a regular basis at all, which means most rate cards currently on the market have never been tested against the demand curve they were built to match. The breakpoint sitting in a rate card today was very likely set once, by convention, and never revisited since. Given how much revenue passes through that one number, leaving it to chance is not a defensible way to run a pricing model.