Price Elasticity of Demand in Usage-Based SaaS Pricing
Segmenting your customer base reveals hidden elasticity gaps that blended pricing metrics mask.

Price elasticity of demand measures how many customers leave, or how much they cut back, when a unit of consumption costs more. In usage-based pricing, that number decides where a tier breaks, how big a credit bundle should be, and whether a token price cut costs the company money or makes it more. Most companies get this wrong before they even start, because they run one blended elasticity number across a customer base that actually contains two or three different markets.
What price elasticity of demand measures and why the SaaS range is narrower than it looks
The formula is simple. Take the percentage change in quantity demanded and divide it by the percentage change in price. The result comes out negative, by convention, since demand falls when price rises. The sign never tells you anything useful. The size does.
Published estimates put typical B2B SaaS elasticity between -0.4 and -0.8. Raising the price 10% causes demand to drop somewhere between 4% and 8%. That's inelastic territory: buyers don't bolt at the first price hike, mostly because switching a piece of embedded software costs real money. Procurement cycles, data migration, retraining, integration work that took months to build the first time. All of that friction sits between a customer and the exit.
But that blended figure hides more than it reveals, and treating it as a single fact about the market is the mistake most pricing teams never catch. A range of -0.4 to -0.8 can describe a market where enterprise accounts run near zero elasticity while self-serve small-business accounts run far hotter. Enterprise buyers face procurement friction, multi-year contracts, and integration depth deep enough to make switching genuinely expensive, so their elasticity tends to be significantly lower than the blended average. SMBs face far less of that friction and can exit far more quickly when a price change doesn't sit well. Applying one number to both segments mispricess one of them every time. An average elasticity figure is an average that erases the two markets hiding inside it. It's an average that erases the two markets hiding inside it.
How much elasticity measurement is worth
Price Intelligently found that a 1% improvement in price optimization produces an 11.1% increase in profit, ahead of a matching 1% gain in customer acquisition, retention, or cost-cutting. Price is the highest-leverage lever in the business, and it's the lever most companies touch least often.
Firms that use elasticity data to guide packaging and overage design see swings of up to 18 percentage points in net dollar retention. An expansion-driven business retains and grows revenue on the back of that data. One without it leaks revenue quietly, through mispriced tiers nobody notices until churn appears in the numbers months later, caused by the mispricing itself but usually blamed on something else.
Only 24% of companies run pricing experiments on any regular schedule, and the reason isn't mysterious. Pricing changes feel riskier than they are. A bad pricing change touches every customer at once, and the damage can become visible only weeks later in a churn dashboard, often attributed to unrelated causes instead of the price change that actually caused it. Nobody wants to own that mistake, so nobody runs the test that would have caught it early.
Three methods for measuring elasticity in usage-based pricing contexts
Three approaches dominate, and each fits a different stage of the pricing lifecycle. None replaces the other two.
The Van Westendorp Price Sensitivity Meter asks customers four questions: at what price would this be so cheap you'd question the quality, at what price is it a bargain, at what price does it start to feel expensive, and at what price is it too expensive to consider. Plotted together, those four curves produce an acceptable price range, and the method needs around 150 responses to hold up statistically. Van Westendorp works best before a pricing model goes live, when there's no usage data yet and the goal is finding the psychological edges of a segment. Its weakness is built into the method: it measures stated willingness to pay, not behavior under real consumption pressure. Usage-based products are exposed to that gap more than most, since customers routinely underestimate how much they'll actually consume once the product sits inside a daily workflow.
Gabor-Granger is more granular. Instead of open-ended thresholds, it shows specific price points and asks purchase intent at each one, building a demand curve elasticity gets derived from directly. It's the sharper tool for a discrete decision, like where to set a tier boundary or how to price a credit bundle, because it produces a revenue-maximizing point instead of a broad zone of acceptability.
Live experimentation beats both, because it measures what customers do instead of what they say they'll do. Segment testing, geographic price splits, feature-gated elasticity tests all fall under this umbrella. For usage-based products, regular experimentation is what catches pricing errors before they compound. For usage-based products, the test needs to cover threshold placement alongside the headline rate: moving where a tier breaks, even by a small margin, can shift more volume than adjusting the per-unit price ever will.
A fourth signal gets ignored almost everywhere, and it's the cheapest one available: the usage data already sitting in the billing system. Consumption drop-offs, credit burn rate, the timing of upgrades and downgrades all encode elasticity in real time, for free. Most companies never structure their billing data to surface any of it, so the answer sits unread in a database while the team commissions a survey to ask a question the billing logs already settled.
How elasticity behaves differently across usage tiers
A single per-unit rate assumes every customer sits at the same point on the demand curve. They don't, and pretending otherwise is where flat-rate usage pricing quietly loses money on both ends at once.
A low-usage customer still exploring the product runs highly elastic. A surprise bill, or even a modest per-unit bump, can end the relationship before it produces a dollar of expansion revenue. A high-usage customer with the product wired into daily operations sits near the opposite end: workflows are embedded, switching costs real time and real money, and the per-unit rate matters far less than uptime and continuity. Charge both the same flat rate and the company loses twice. It leaves money on the table with the inelastic power user, and it applies unnecessary friction to the elastic one at the exact moment they're most likely to churn.
Volume tiers exist to fix this. Declining per-unit rates at higher consumption bands let a vendor capture the inelasticity of its most embedded customers while softening the price signal for customers still in the growth phase. Customers sort themselves by usage depth, and revenue scales with that depth instead of fighting it.
Threshold placement matters as much as the rate itself, and this is where most usage-based pricing actually breaks. A tier boundary set too low pushes elastic customers into a higher-cost band before they've built up enough workflow dependency to absorb the jump without resentment. Enterprise procurement surveys report that 61% of organizations have cut SaaS projects specifically over unplanned cost increases, and that's a threshold problem vendors rarely trace back to its source. More often it's a threshold set in the wrong place for the segment crossing it, and the vendor never finds out why the account left.
AI inference pricing makes the pattern hard to miss. Token prices fell sharply year over year across major model providers, and total AI spending grew anyway, because usage volume scaled faster than the cost cuts could offset it. That's low elasticity once a workflow is embedded: the customer stops reacting to the price per token, because the token has already become a sunk cost of doing business. But the sticker shock at first exposure, the moment a new user sees a raw per-token or per-call price for the first time, is in a completely different, far higher elasticity regime. Confuse the two and a vendor ends up pricing a mature workflow like a first-time trial, or the other way around.
Credit and token pricing as an elasticity management layer
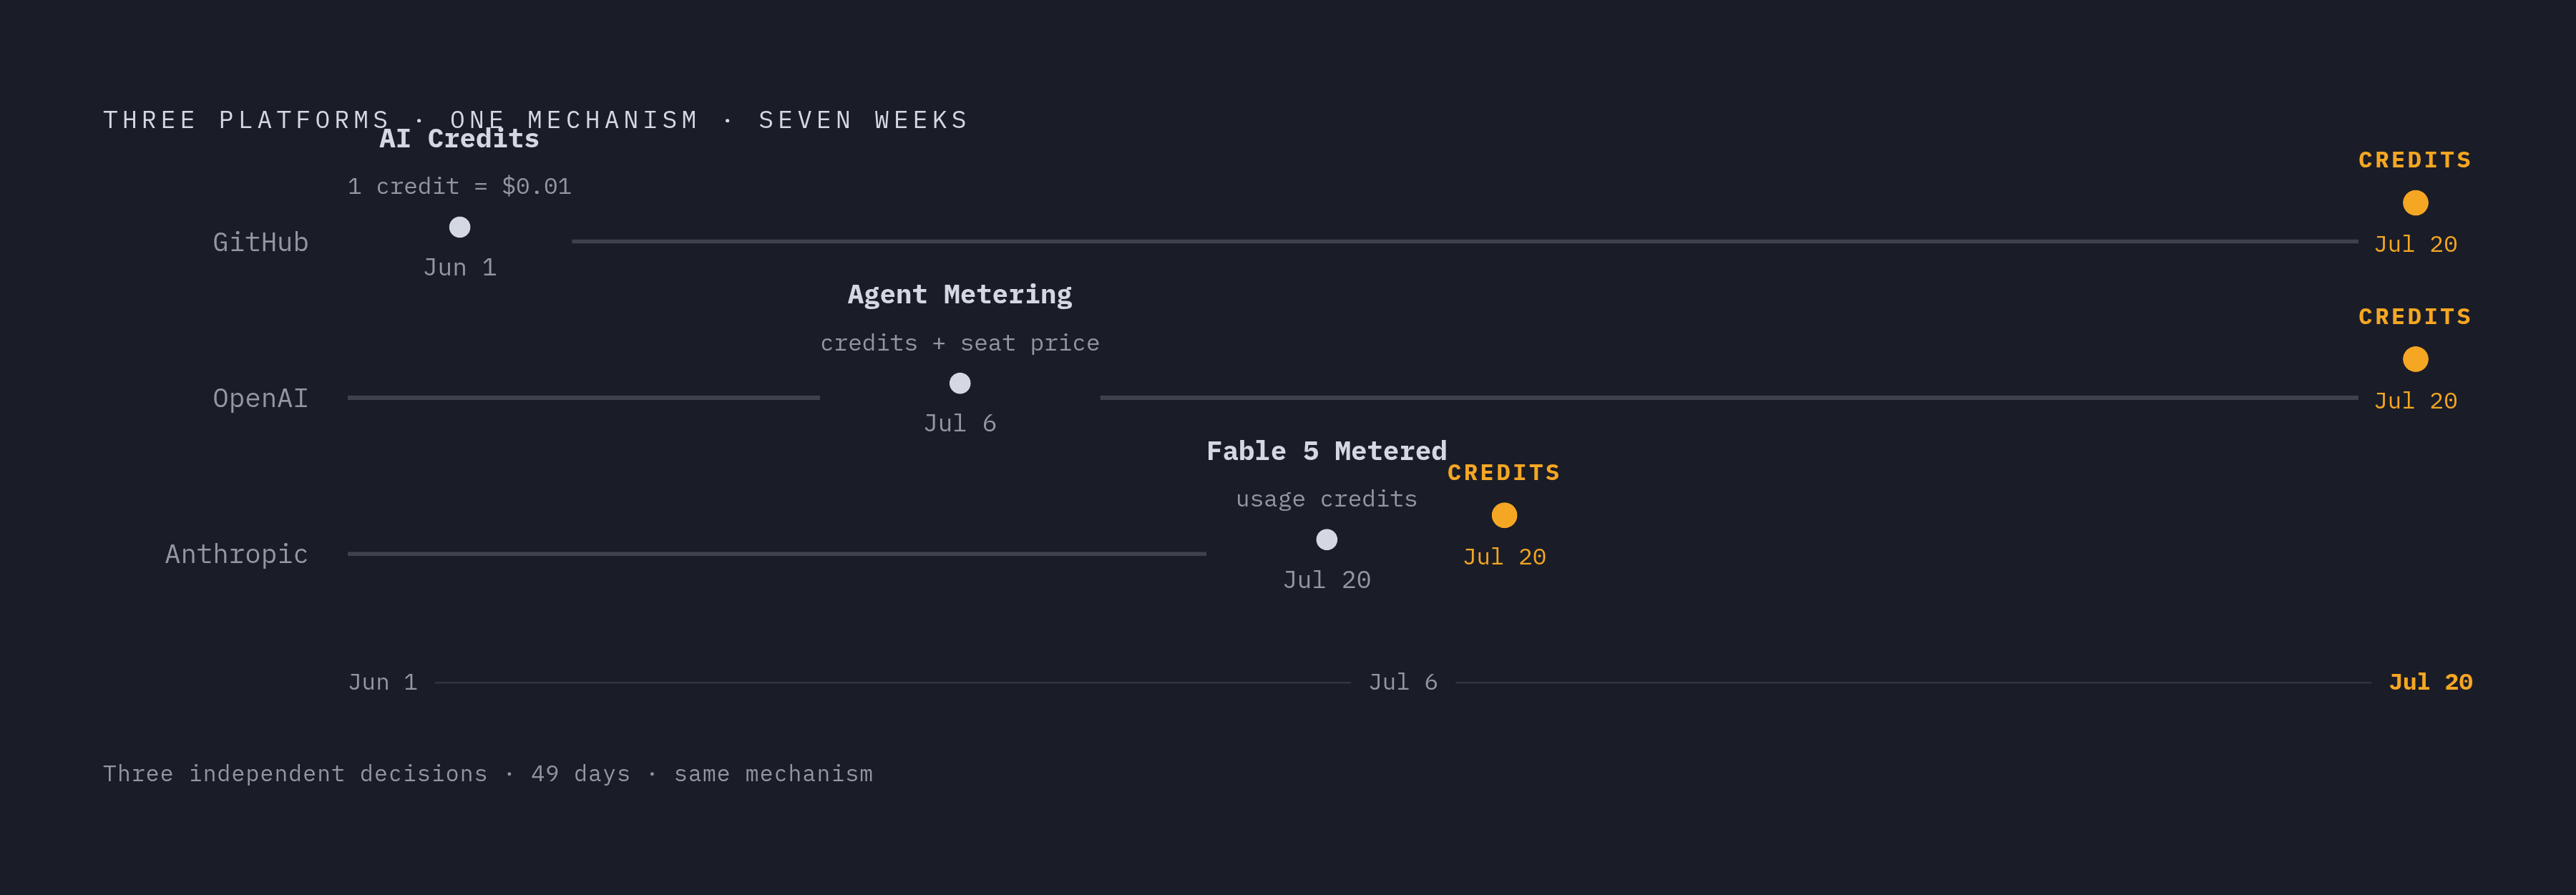
Something notable happened across AI developer platforms in a seven-week span between June 1 and July 20, 2026: three major players converged, independently, on the credit as the core unit of billing. GitHub moved Copilot to AI Credits on June 1, 2026, pricing one credit at $0.01 and drawing down against token usage while leaving basic completions free. OpenAI ended its Workspace Agents free preview on July 6, 2026, and began metering every agent run in credits stacked on top of seat pricing. Anthropic switched Fable 5 to metered usage credits on July 20, 2026. Three unconnected companies landing on the same mechanism inside seven weeks is a shared bet on a single psychological trick. It's a shared bet on a single psychological trick.
Credits work because they sell something that feels fixed, a balance, a number sitting in an account, while the actual metering happens invisibly at the token level; this hidden metering is the real mechanism, producing the sense of a fixed balance even though usage is tracked token by token beneath it. A customer watching a credit balance tick down experiences a budget. A customer watching a live per-token meter experiences a price. Those aren't the same event psychologically, even when the underlying cost is identical down to the decimal.
That distinction moves the elastic decision earlier in the customer's timeline. Price sensitivity shifts from the moment of consumption, where friction kills usage mid-session, to the moment of purchase, where the customer already committed to the spend up front. A prepaid credit wallet turns a thousand small elastic decisions into one larger one, made before the customer is mid-task, which is exactly when friction does the most damage to usage volume.
The complexity lives in the token pricing behind those wallets. OpenAI's gpt-5.6 family spans three tiers: gpt-5.6-sol at $5 input and $30 output per million tokens, gpt-5.6-terra at $2.50 and $15, gpt-5.6-luna at $1 and $6. Anthropic's Claude Opus 4.8 runs $5.00 and $25.00 per million tokens in standard mode, jumping to $10 and $50 in Fast Mode, with batch processing cut 50% across every Anthropic model and prompt caching cutting cached input costs by 90%. Both manage elasticity the same way: the vendor controls how visible the per-unit cost stays to the person actually spending it, and that control is what produces the difference in perceived elasticity.
Hybrid pricing, subscription base plus consumption overage, adjusting for segment elasticity simultaneously
Hybrid pricing handles inelastic core users and elastic marginal users at once, instead of forcing a choice between them. A flat subscription base locks in the inelastic core, predictable for the customer and predictable for the vendor's revenue forecast, while a consumption layer sits on top for usage that scales past the base. The elastic customer stays parked on the subscription and never feels a meter running. The inelastic heavy user self-selects into the overage layer, where continuity matters more than the per-unit charge at the exact moment that charge gets decided.
The pattern recurs across the AI product landscape with different mechanics per vendor but the same underlying shape. Microsoft Copilot combines a subscription base with additional credits for usage beyond the included allotment, capturing steady-state users without forcing a mid-contract renegotiation the moment an account's AI workload jumps. HubSpot allocates a set credit pool per plan and charges $10 per additional 1,000 credits beyond it. Zendesk bundles a fixed number of automated resolutions into its plans and sells top-off credits at $1.50 each. Monday.com prices AI credit top-offs at $0.01 apiece on top of preset monthly allotments. Adobe bundles Firefly generative credits into Creative Cloud plans, or sells standalone Firefly plans, with the monthly allowance varying by tier. Atlassian combines a subscription base, bundled AI entitlements, and consumption overage inside a single contract, rather than treating them as separate products with separate bills.
None of these structures match each other exactly, and they shouldn't. An image-generation workload and a helpdesk-automation workload consume at completely different rates, so copying one vendor's tier design onto another company's product is a mistake that shows up in the very next billing cycle. The logic that produces this stays constant, though: separate the inelastic core from the elastic edge, price each on its own terms, and let the customer's actual usage decide which side of the line they land on.