Event Ingestion Pipeline Design for High-Volume APIs
Build your pipeline to handle billing-scale traffic before it breaks in production.
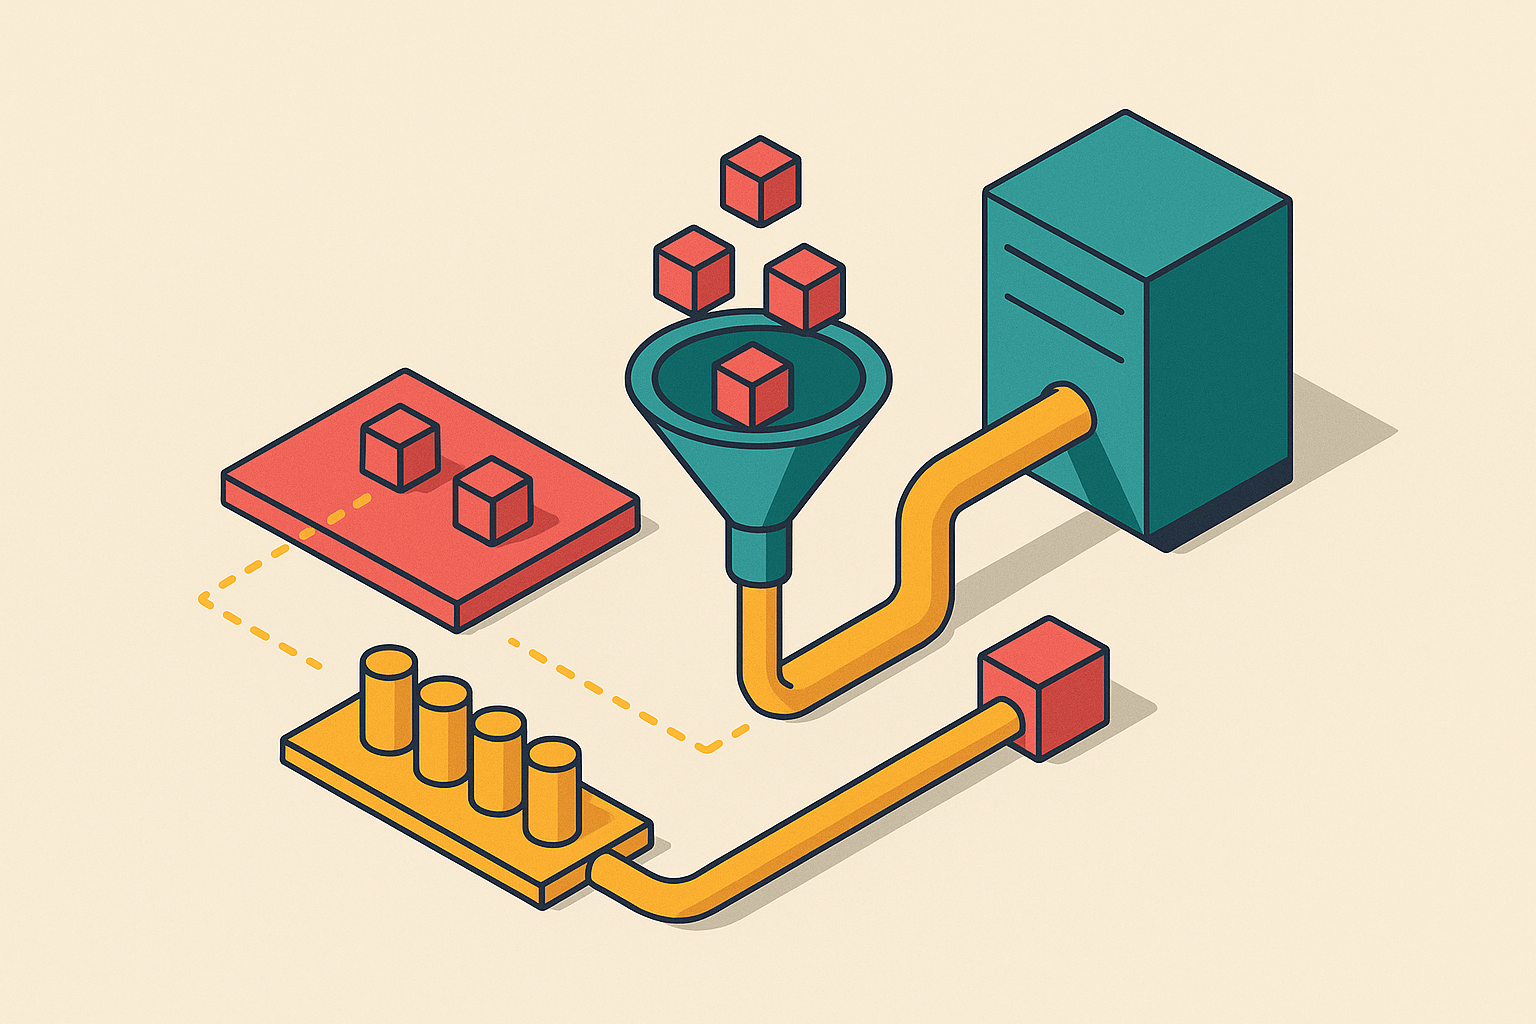
An event ingestion pipeline built to handle high volume looks simple on paper: receive an event, store it, move on. At scale, that simplicity is an illusion, because every assumption you made about latency, ordering, and delivery guarantees starts to break the moment real traffic hits it.
The failure modes that show up under load are specific and repeatable. A traffic spike overwhelms an ingestion endpoint and takes the whole intake path down with it, a phenomenon commonly called a thundering herd. Events get dropped with no error signal at all, so nobody knows anything went wrong until a customer complains. Retries and at-least-once delivery semantics create duplicate processing, which in a billing context means double-charging a customer for the same unit of work. And a slow downstream dependency, maybe a database or a billing API having a bad day, propagates backpressure upstream until it freezes intake entirely.
For AI and SaaS products, these failures aren't abstract engineering concerns. Billing events flow through these same pipelines alongside analytics events, and a dropped token-consumption event isn't a gap in a dashboard somewhere. It's lost revenue, or worse, an invoice that's wrong in a way nobody catches until a customer disputes it. Standard SaaS billing tooling was built around one event per customer per month: a renewal, a subscription tick. AI products generate thousands of small billable events per customer per minute. That difference in volume and granularity reframes the ingestion pipeline from a data convenience layer into revenue-critical infrastructure, full stop.
None of these failure modes come from one bad component. They emerge from how choices at collection, buffering, processing, and delivery interact with each other under conditions nobody tested for. This piece walks through those choices layer by layer, so you can make them on purpose instead of discovering them in an incident review.
The four-tier pipeline model every high-volume ingestion system is built on
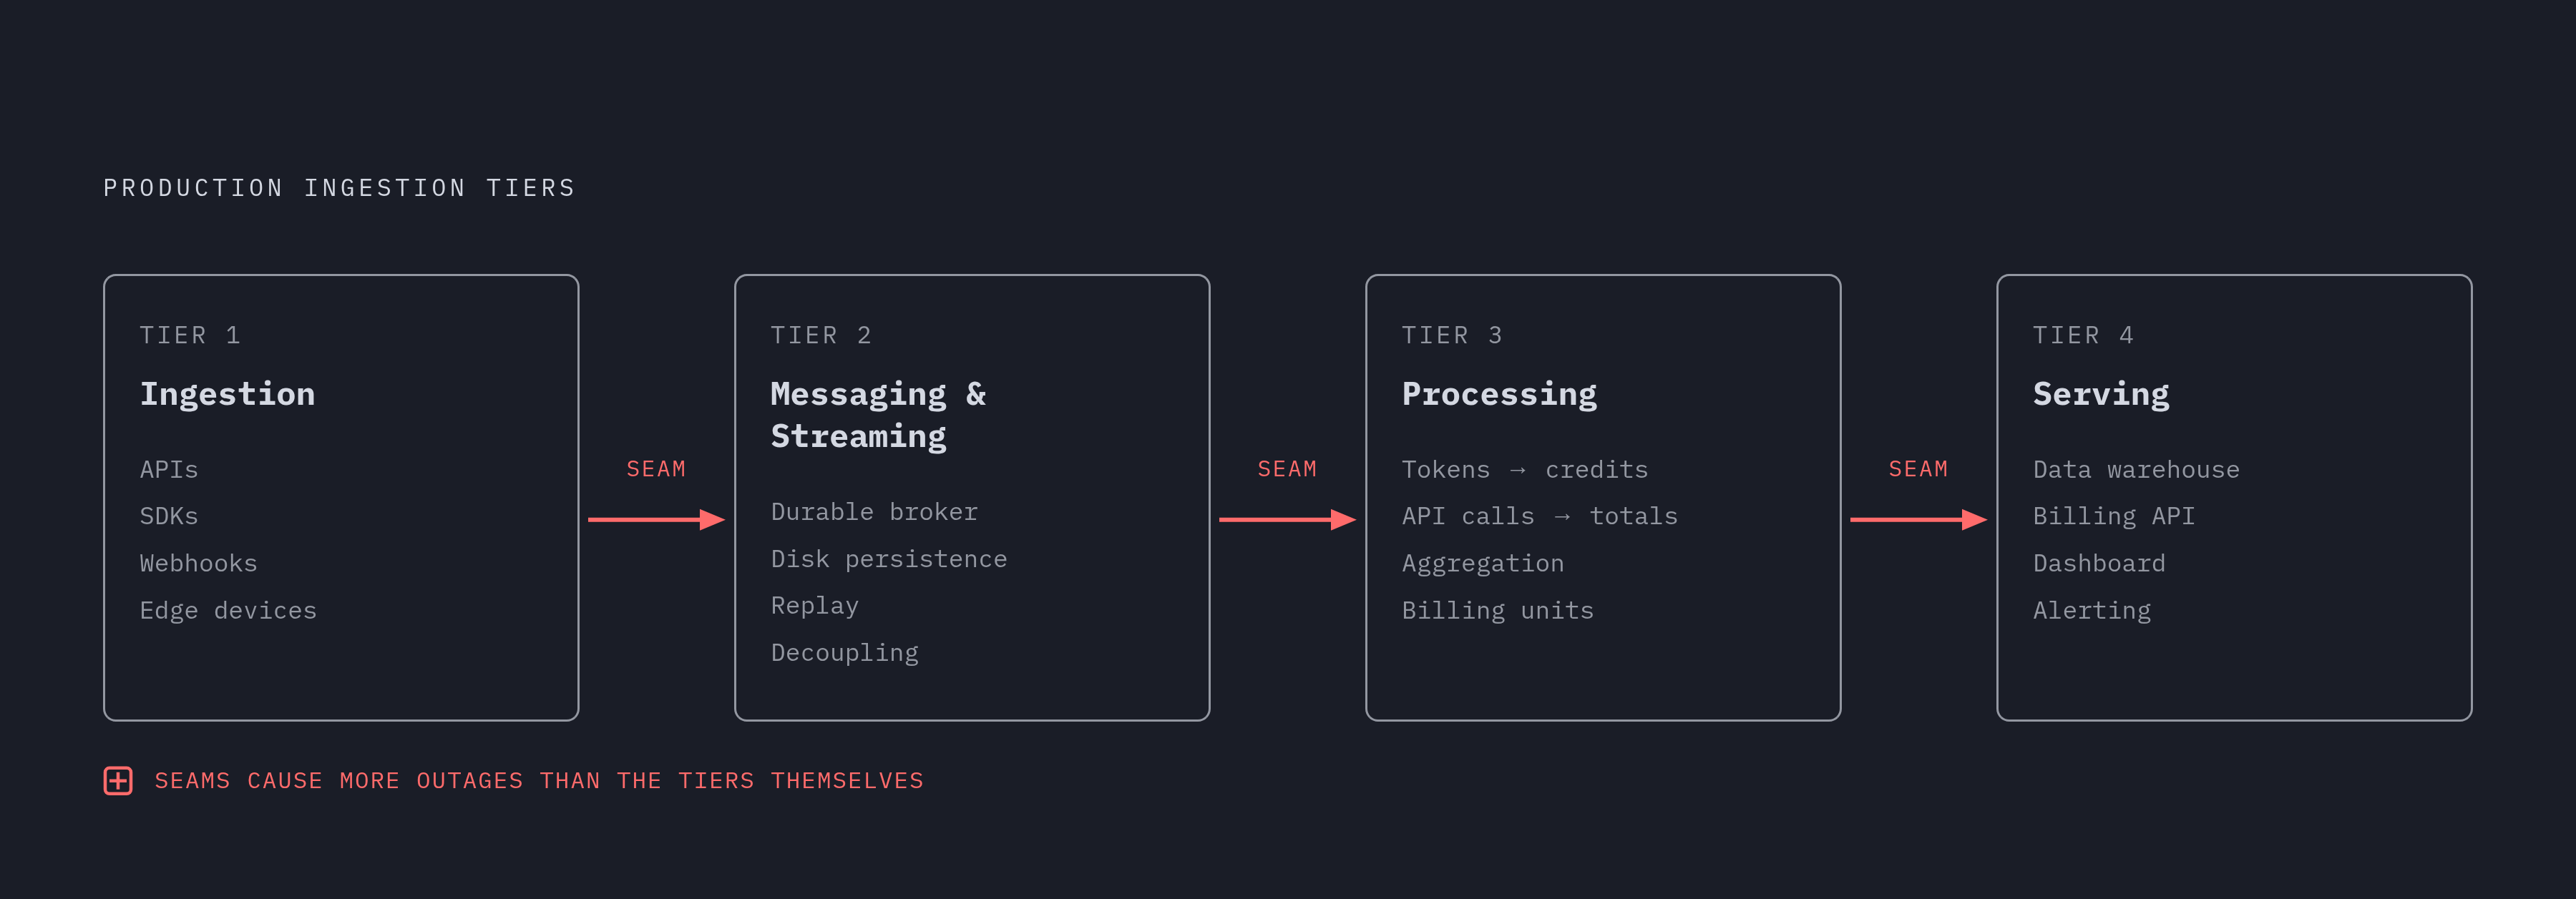
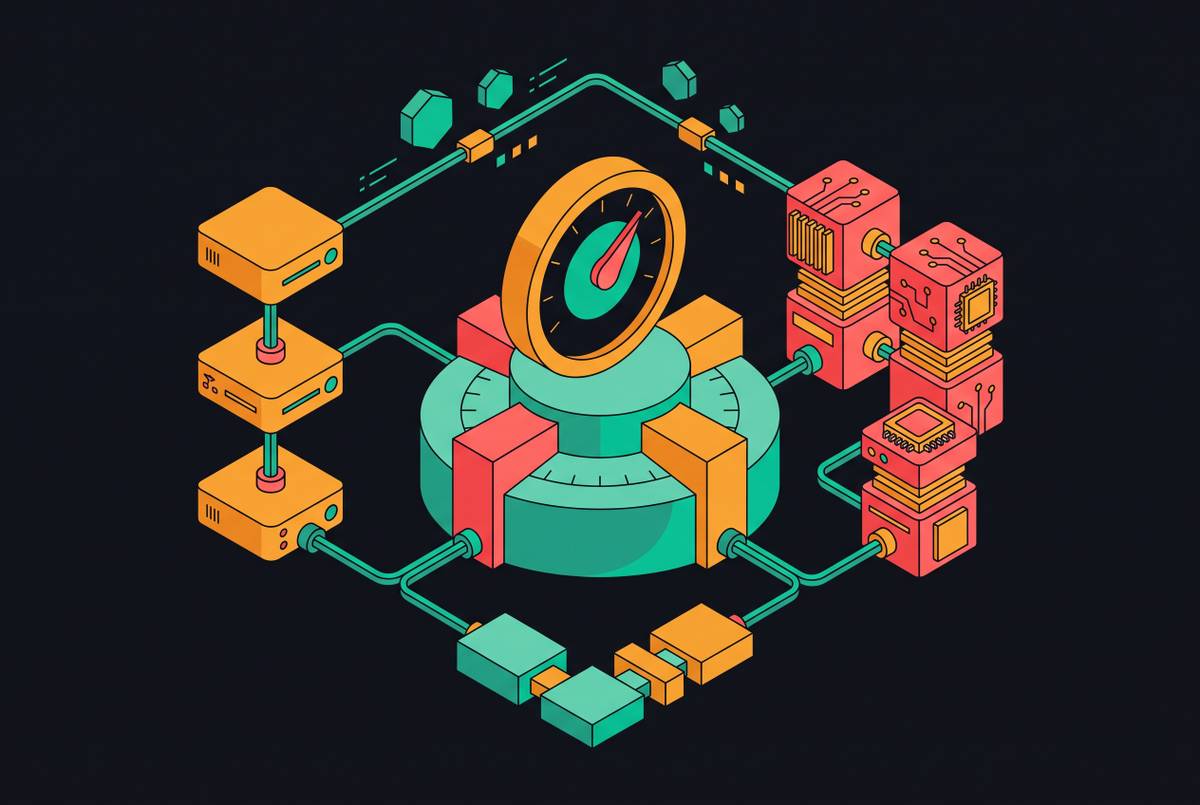
Nearly every production-grade ingestion system, regardless of the specific tools behind it, breaks down into four tiers: ingestion, messaging and streaming, processing, and serving. This isn't a vendor's marketing pitch. It's a logical separation that holds up because each tier has its own scaling characteristics and its own way of failing.
Tier one, ingestion, collects raw events from APIs, SDKs, webhooks, or edge devices. Its only job is to absorb whatever volume shows up without pushing backpressure onto the caller. Tier two, messaging and streaming, is a durable broker that sits between producers and consumers, persists events to disk, and lets you replay them later. This is a meaningful departure from a traditional queue, which deletes a message the moment it's consumed. A streaming platform keeps the data around so multiple independent consumers can read it, and so you can recover by replaying history if something downstream breaks.
Tier three, processing, turns raw events into units that mean something: API calls become monthly totals, raw token counts become billable credits, log lines become gigabytes processed. Tier four, serving, hands the processed output to whatever needs it next, whether that's a data warehouse, an operational billing API, a dashboard, or an alerting system.
Here's the part that's easy to miss: the seams between tiers cause more outages than the tiers themselves. A message that leaves the broker successfully but never gets picked up by a crashed consumer, an aggregation that completes but never reaches the serving layer because of a timeout, these handoff failures are where production pipelines actually break. Get the tiers right and still ignore the handoffs, and you'll have the same problems anyway.
Ingestion layer design: accepting events without becoming the bottleneck
The ingestion endpoint has one job above all others: accept events as fast as callers send them, and never become the reason a calling application slows down. That means doing as little work as possible at the point of intake. Validate the schema, stamp a timestamp, write to the buffer. That's it. Enrichment, deduplication, and transformation belong downstream, not here.
How you accept events matters more than most teams initially think. HTTP POST endpoints are the easiest thing to hand a developer, but at scale they demand careful attention to connection pooling and timeout settings, or you'll bleed capacity to hung connections. SDK-side batching, where the client accumulates events locally and flushes on a timer or once a buffer fills, cuts down both the pressure on your intake layer and the raw network overhead of one request per event. For very high-frequency producers, an AI inference service emitting a token-usage event on every completion, gRPC and persistent connections reduce the per-event tax that HTTP incurs on every single call.
Handling spikes at the edge takes a few coordinated moves. Rate limiting and admission control keep one misbehaving producer from taking the whole system down. Client-side buffering with exponential backoff on retry smooths bursts before they ever reach the broker. And when you do need to shed load, do it loudly: return a 429, not a silent drop. A caller that gets an error can adapt. A caller whose event vanished has no idea anything happened.
There's a quieter problem worth naming directly: invisible traffic. Background jobs, retry attempts, webhook callbacks, and agent sub-tasks all generate events that live outside the main request path most ingestion layers are built to watch. This gap tends to surface months later, when finance sits down to reconcile infrastructure spend against billed revenue and the numbers don't line up. If your ingestion layer only instruments the obvious API endpoint, your metering is incomplete by design, and you won't know it until the accounting doesn't add up.
Message brokers and streaming platforms: choosing the right durable buffer
The broker sits at the center of the pipeline, and what it needs to do is deceptively short to list: persist events durably, decouple how fast producers write from how fast consumers read, support several independent consumers reading the same stream, and allow replay when something goes wrong downstream.
Apache Kafka remains the default choice for a reason. It's distributed, fault-tolerant, and built specifically for high-throughput streaming; vendor documentation cites message latencies as low as 2 milliseconds, and Kafka clusters in production handle petabytes of data and trillions of messages without falling over. Its log-based storage model means events stay replayable, which matters enormously when a processing bug corrupts your aggregations and you need to rerun history cleanly rather than accept the loss. The tradeoff is operational: Kafka clusters need tuning, partition management, and continued attention from someone who understands the internals. It is not a install-and-forget system.
Amazon Kinesis and similar managed services trade some of that control away in exchange for lower operational overhead: less say over retention policy, partition behavior, and cost at very high volume, but also fewer 2 a.m. pages about a stuck consumer group. That tradeoff makes sense when your team's actual bottleneck is operational headcount, not raw throughput. Redpanda offers a middle path worth knowing about: Kafka-compatible on the wire, but packaged as a single binary with meaningfully less operational overhead, which makes it a reasonable choice when Kafka's complexity, not its capability, is what's holding a team back.
A handful of configuration decisions determine how the whole thing behaves in practice. Partition count sets your ceiling on consumer parallelism; too few partitions and your throughput caps out no matter how many consumers you add. Replication factor is a direct tradeoff between durability and write overhead. Retention period decides how far back you can replay, and billing pipelines generally need to hold onto that history much longer than a pure analytics pipeline would. Consumer group design lets a billing engine, an analytics job, and an audit log all read the same stream independently, without one interfering with another.
Replay isn't a nice extra feature to have. When a processing bug generates incorrect metering data, replaying the stream is the only way to recover the correct numbers. Without it, that gap in your billing history is simply unfillable, and you're stuck manually reconstructing invoices from whatever partial logs you have lying around.
Processing patterns: stateful aggregation, micro-batching, and when to use each
The processing tier takes a raw event, "API call received at 14:03:22.441," and turns it into something billable or queryable, "customer X consumed 1,847 API calls in November." Three patterns dominate how teams do this as of 2025.
Pure stream processing handles events one at a time as they arrive. It gives you the lowest latency and the most complexity, and it earns its keep when you need real-time entitlement checks, verifying a customer has enough credit balance before letting a request through, where a delay of even a few seconds is unacceptable. Micro-batching groups events into small windows, seconds to a few minutes, trading a bit of latency for lower cost and simpler operations; it became a more attractive default as cloud compute pricing shifted through 2024 and 2025 in ways that favor workloads with bursty, unpredictable traffic patterns. Lambda and Kappa architectures address the same problem from different angles: Lambda runs a batch path and a streaming path in parallel, while Kappa collapses both into a single streaming system. Consolidating onto Kappa-style architecture has become a widely adopted pattern this year, largely because running two parallel codepaths for the same logic is expensive to maintain and easy to get subtly wrong.
Stateful processing, aggregations that need memory of what came before, running totals, session windows, rate calculations, is its own discipline. Apache Flink was purpose-built for this: native windowing, and event-time semantics that handle events arriving out of order without corrupting the aggregate. The failure mode to watch for is state loss. If a pod crashes or a scaling event wipes local state, you have to recompute the aggregation from the broker's replay log, which is exactly why broker retention isn't optional for a billing pipeline; it's the only backstop you have.
Event-time versus processing-time matters more than it sounds like it should. Events arrive late, sometimes by seconds, sometimes by minutes if a client was offline. Process them in wall-clock order and your aggregations come out wrong. Event-time watermarks, which track how far behind the pipeline is willing to wait for late data, are what make billing math actually accurate.
For the serving layer where this metered data lands, ClickHouse has become a common choice: columnar storage and fast aggregation queries suit the high-cardinality, append-heavy write pattern that usage events generate. Put it all together and a typical stack looks like Kafka for ingestion and buffering, Flink or micro-batch workers for aggregation, ClickHouse for storage, and a billing API layer on top, each tier scaling independently of the others.
Idempotency and deduplication: designing for the duplicates that will arrive
In any system built on at-least-once delivery, duplicates aren't an edge case you might hit someday. They are a guaranteed eventual occurrence, and designing as though they won't happen is how billing pipelines end up double-charging customers.
Duplicates show up from several directions at once. A client retries after a network timeout, not knowing the original event actually landed, just that the acknowledgment got lost somewhere. A consumer crashes after processing a message but before committing its offset, so it reprocesses the same message on restart. The broker redelivers messages during a partition rebalance. A client SDK flushes its local buffer again after a restart, unaware some of those events already went out.
The fix is an idempotency key, assigned by the producer at the moment the event is created, not generated later at intake. Typically this is some combination of a producer ID, a timestamp, and a sequence number or UUID, and it has to stay identical across every retry of that same event. Before processing anything, you check that ID against a fast lookup store, Redis is the standard tool for this, and if you've seen it before, you drop it; if it's new, you process it and mark it seen. The cost of that Redis lookup is trivial. The cost of processing the same billing event twice, and generating a duplicate charge a customer will eventually notice and dispute, is not.
How long you keep those IDs around depends on how long retries can realistically take to show up; billing pipelines tend to need a longer window than pure analytics does, since a retry might legitimately arrive hours later. TTL-based expiry in Redis keeps memory use bounded without quietly losing coverage on older events.
Kafka does support exactly-once semantics within a Kafka-to-Kafka flow, through idempotent and transactional producers paired with read-committed consumers. But the moment your pipeline writes to something outside Kafka, a database, a billing API, that guarantee stops at the boundary. You still need application-level idempotency keys for anything crossing that line. And before any of this goes to production, replay the same event stream twice against staging and diff the output. If the numbers match, you're in reasonable shape. If they don't, you just found the bug before a customer did.
Resilience patterns: circuit breakers, backpressure, and graceful degradation
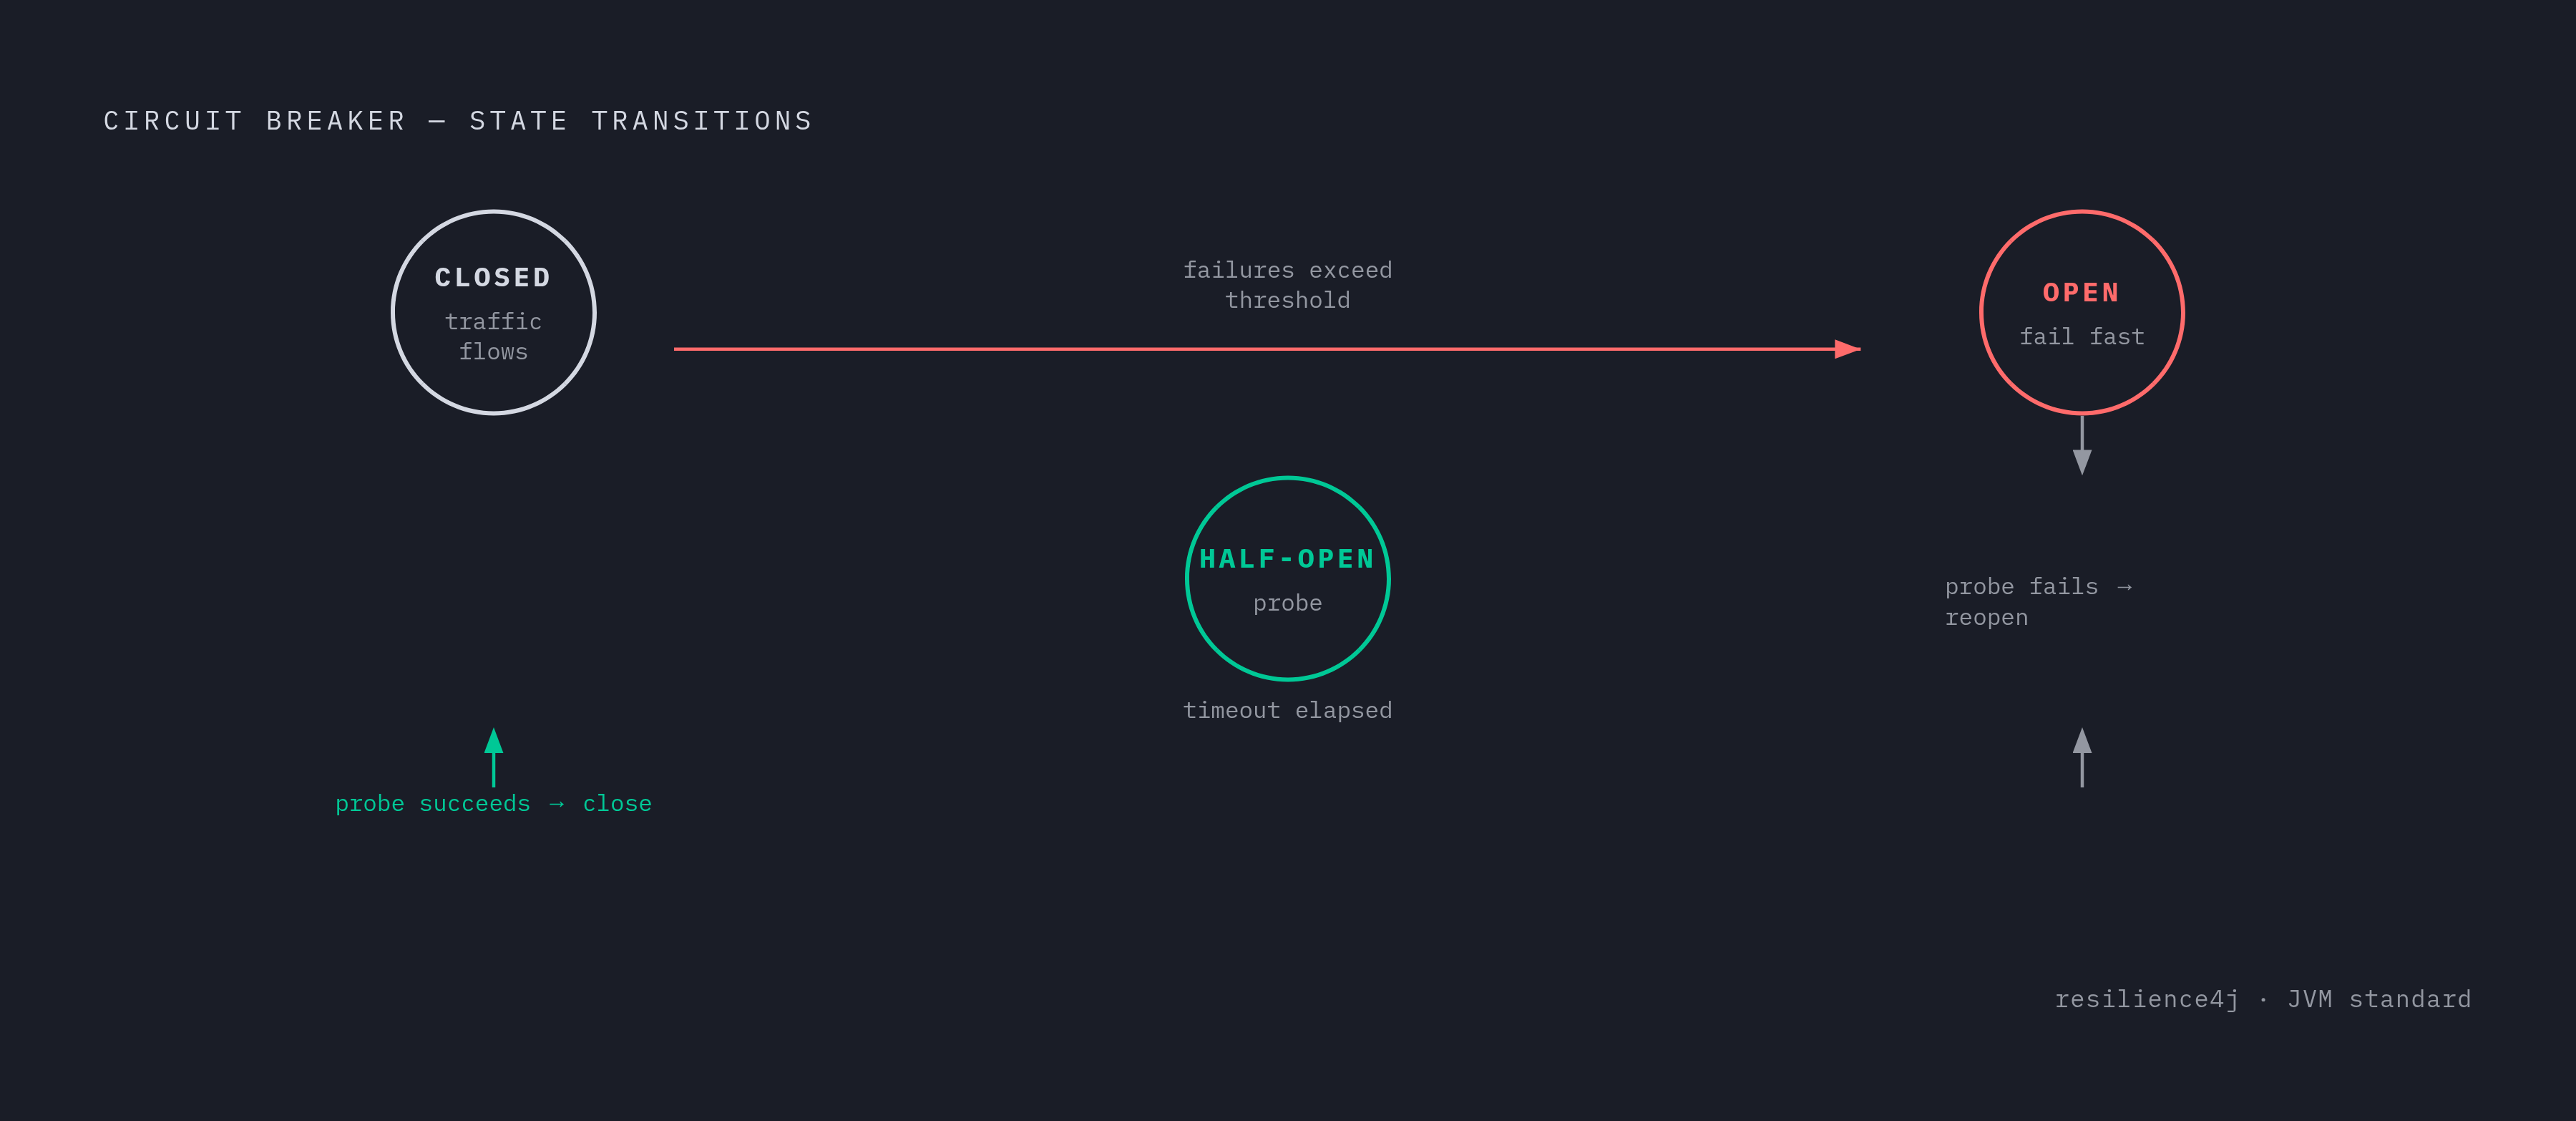
A component that crashes is, in a strange way, the easier problem. It fails visibly, restarts, and the system recovers. A component that goes slow without crashing is far more dangerous, because it holds connections open, ties up thread pools, and quietly drags the rest of the pipeline down with it.
This is exactly what the circuit breaker pattern exists to prevent. When a downstream dependency, a database, a billing API, an enrichment service, starts responding slowly instead of failing outright, the right move is to fail fast: return an error, let the caller retry with backoff, and don't let one slow dependency choke the whole system. A circuit breaker moves through three states: closed under normal conditions, open once it's decided the dependency is unhealthy and it should stop sending traffic, and half-open while it cautiously probes to see if things have recovered. Libraries like resilience4j on the JVM implement this cleanly, and the same logic can be built by hand around any health-checked client if you're not on the JVM.
Backpressure needs the same directness. An unbounded queue feels safe until it isn't: memory climbs quietly, then the process falls over with an out-of-memory crash and no warning. Bounded queues with explicit rejection are the honest alternative, paired with 429 responses and a Retry-After header so producers know to slow down instead of pipeline just silently falling behind. Consumer lag, how far behind a Kafka consumer group has fallen from the head of the stream, is the single most useful operational number for telling whether the pipeline is keeping up or slowly drowning.
Dead letter queues handle the events that fail no matter how many times you retry them. After N attempts, they go to a DLQ for a human to look at and replay manually, which keeps one malformed event from jamming an entire consumer indefinitely.
For anything touching billing, the rule is simple and non-negotiable: if the billing API goes down, keep ingesting and buffering. Never drop events to protect a downstream system, because the downstream system can recover; a dropped billing event usually can't. The ingestion SLA and the processing SLA need to be separate commitments, so the pipeline's durability guarantee holds even while something further downstream is having a bad day. And scale testing deserves real attention here: a pipeline that handles current volume comfortably may buckle at ten times that, and horizontal scaling of consumers, adding Kafka partitions, and autoscaling ingestion workers all need to be tested against realistic load projections well before production traffic forces the issue.
Observability: the metrics and signals a production pipeline must expose
Most pipeline outages don't announce themselves with a crash. They show up as slow, quiet degradation: consumer lag creeping upward, duplicate rates ticking higher, a DLQ that's been growing for three days and nobody noticed. None of that is visible without the right instrumentation in place.
Four layers of metrics cover the ground that matters. At ingestion: events received per second, HTTP error rates at the intake endpoint broken out by 4xx versus 5xx, and client-reported retry rates. At the broker: consumer group lag per partition, which is the single most important number in the entire pipeline, along with producer send failure rate and partition imbalance. In processing: events processed per second, latency distribution across p50, p95, and p99, deduplication hit rate, and DLQ depth. And at the business level, the layer teams skip most often: events billed against events ingested for reconciliation, credit balance accuracy checks, and invoice error rate.
Alerting has to match the severity of what it's watching. Consumer lag crossing a defined threshold, say more than a few minutes of unprocessed events sitting in the queue, should page someone immediately. A growing DLQ needs a human to look at it, not another automated retry attempt that's already failed several times. And a sudden spike in the deduplication hit rate is rarely random; it usually means a retry storm somewhere upstream, or a producer bug generating the same event repeatedly. Catch that early, and it's a five-minute fix. Miss it, and it's a billing dispute three weeks later that takes a full afternoon to untangle. Some teams offload the rating and charging side of this entirely to purpose-built infrastructure, such as Flexprice, a metered billing platform for AI and API products that handles token and credit consumption tracking on a single engine so the pipeline itself only needs to emit events accurately.