OpenTelemetry for Usage Metering in SaaS Applications
OpenTelemetry captures billing signals but lacks reconciliation and accuracy safeguards.

OpenTelemetry can carry the data that usage-based billing runs on, but it was never built to finish that job. Usage-based pricing now covers most of the SaaS market, and AI-native companies have pushed adoption even higher; credit-based models are growing fast enough that Figma, HubSpot, and Salesforce have all rolled out credit systems in the past cycle. Every one of these pricing structures depends on the same unglamorous prerequisite: a system that can capture, count, and trust every billable event. Most engineering teams already run OpenTelemetry for observability, so the instinct to route that same signal into billing is understandable. Whether that instinct holds up depends entirely on where you draw the line between what OTel does and what billing actually requires.
OTel's data model does support the signals billing runs on, with meaningful caveats on each side. Counters map cleanly onto API calls or token consumption, Histograms handle payload-size or compute-time tiers, and attributes carry the per-tenant and per-feature context that makes any of those numbers attributable to a specific customer and plan. What OTel does not do is aggregate, reconcile, or render those events into an invoice-ready number; the Collector pipeline emits the data, and something downstream still has to own the step that turns a stream of attributed counter increments into a figure a finance team can sign off on. Teams that treat the observability pipeline as a complete billing system tend to discover the gap the slow way, tracing discrepancies back through the Collector only to find that nothing was ever asked to do the reconciliation work.
Does OTel's data model actually support usage-based billing signals, and where does it fall short?
OpenTelemetry is a CNCF project, graduated in status, that defines a shared standard for instrumentation SDKs, a Collector, and a wire protocol called OTLP, spanning more than a dozen programming languages. It gives you three kinds of signals: traces, logs, and metrics. For metering purposes, metrics matter most, and OTel offers four instrument types worth knowing by name.
A Counter only goes up, which makes it the natural fit for API calls, token consumption, or requests processed; it maps cleanly onto a running usage total. An UpDownCounter tracks values that move in both directions, like active seats or concurrent sessions. A Gauge captures a point-in-time snapshot, such as a current credit balance or queue depth, while a Histogram records the shape of a distribution, useful when pricing depends on payload size or compute time tiers rather than a raw sum.
What makes any of this useful for billing is attributes: the key-value pairs attached to each metric event that tell you whose usage this is, which plan they're on, and which feature they touched. Without those attributes, a Counter is just a number with no owner. OTLP, the protocol that moves this data around, is language-neutral and now supported by most observability backends and a growing number of metering tools.
Here's the limit, though. OTel emits data. Something downstream has to view that data, aggregate it, and turn it into something you can put on an invoice, and treating OTel as if it already does that work is where teams get into trouble. I spent enough time tracing a billing discrepancy back through a Collector pipeline to learn this the slow way: the events were all there, technically, but nothing had ever been asked to reconcile them into a number a finance team could sign off on.
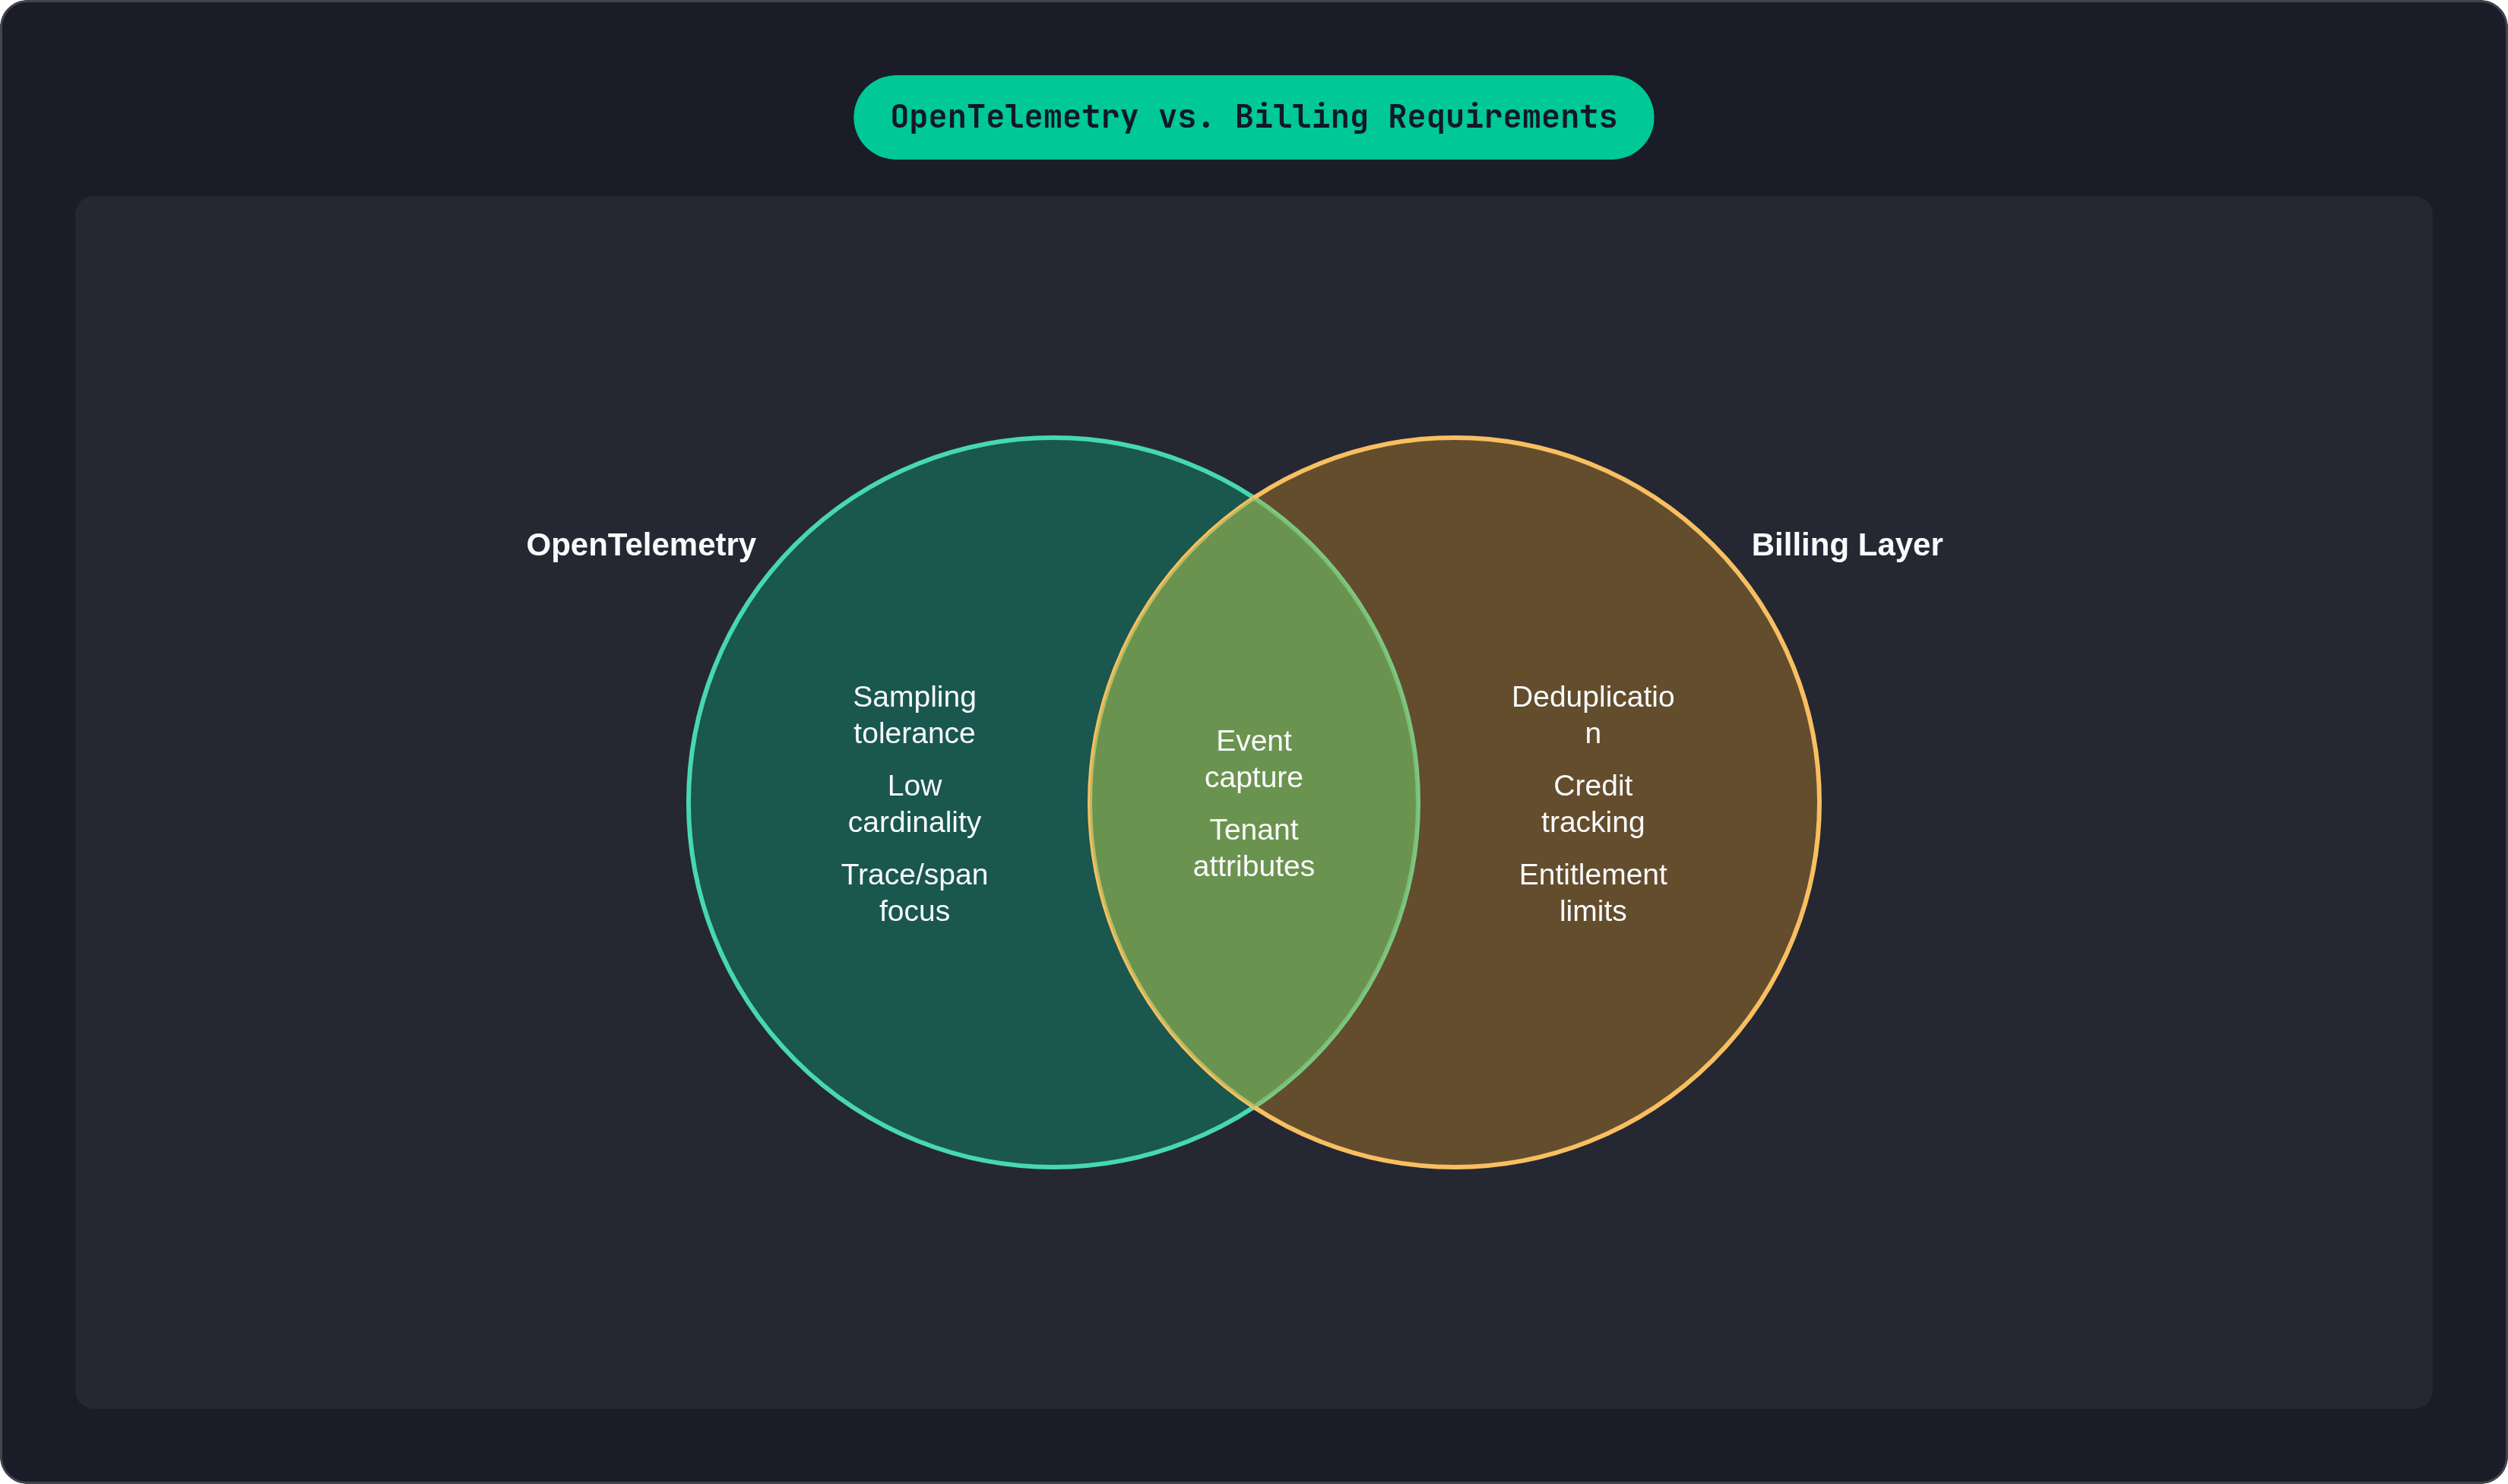
Where observability requirements and billing requirements diverge
Observability tolerates loss. Sampling is standard in distributed tracing; teams often keep only a slice of requests and throw the rest away because a representative sample is good enough for finding a slow database call. Billing has a much lower tolerance for that kind of gap. A sampled billing event risks becoming an under-billed customer, and there's no clean way to explain that gap on an invoice.
The Cursor pricing incident from the past year is a clean illustration of what happens when the two get confused. A single developer on an annually-billed plan burned through 500 requests in one day and generated an enormous invoice. The billing math was correct. What failed was the metering architecture upstream of it, which had no way to surface that trajectory in real time, before the number got that large. Reports on unexpected charges tied to consumption and AI pricing models are common enough now that most CIOs list cost forecasting as their top concern in AI deployment, and those forecasting failures nearly always trace back to a metering gap, not a bad pricing decision.
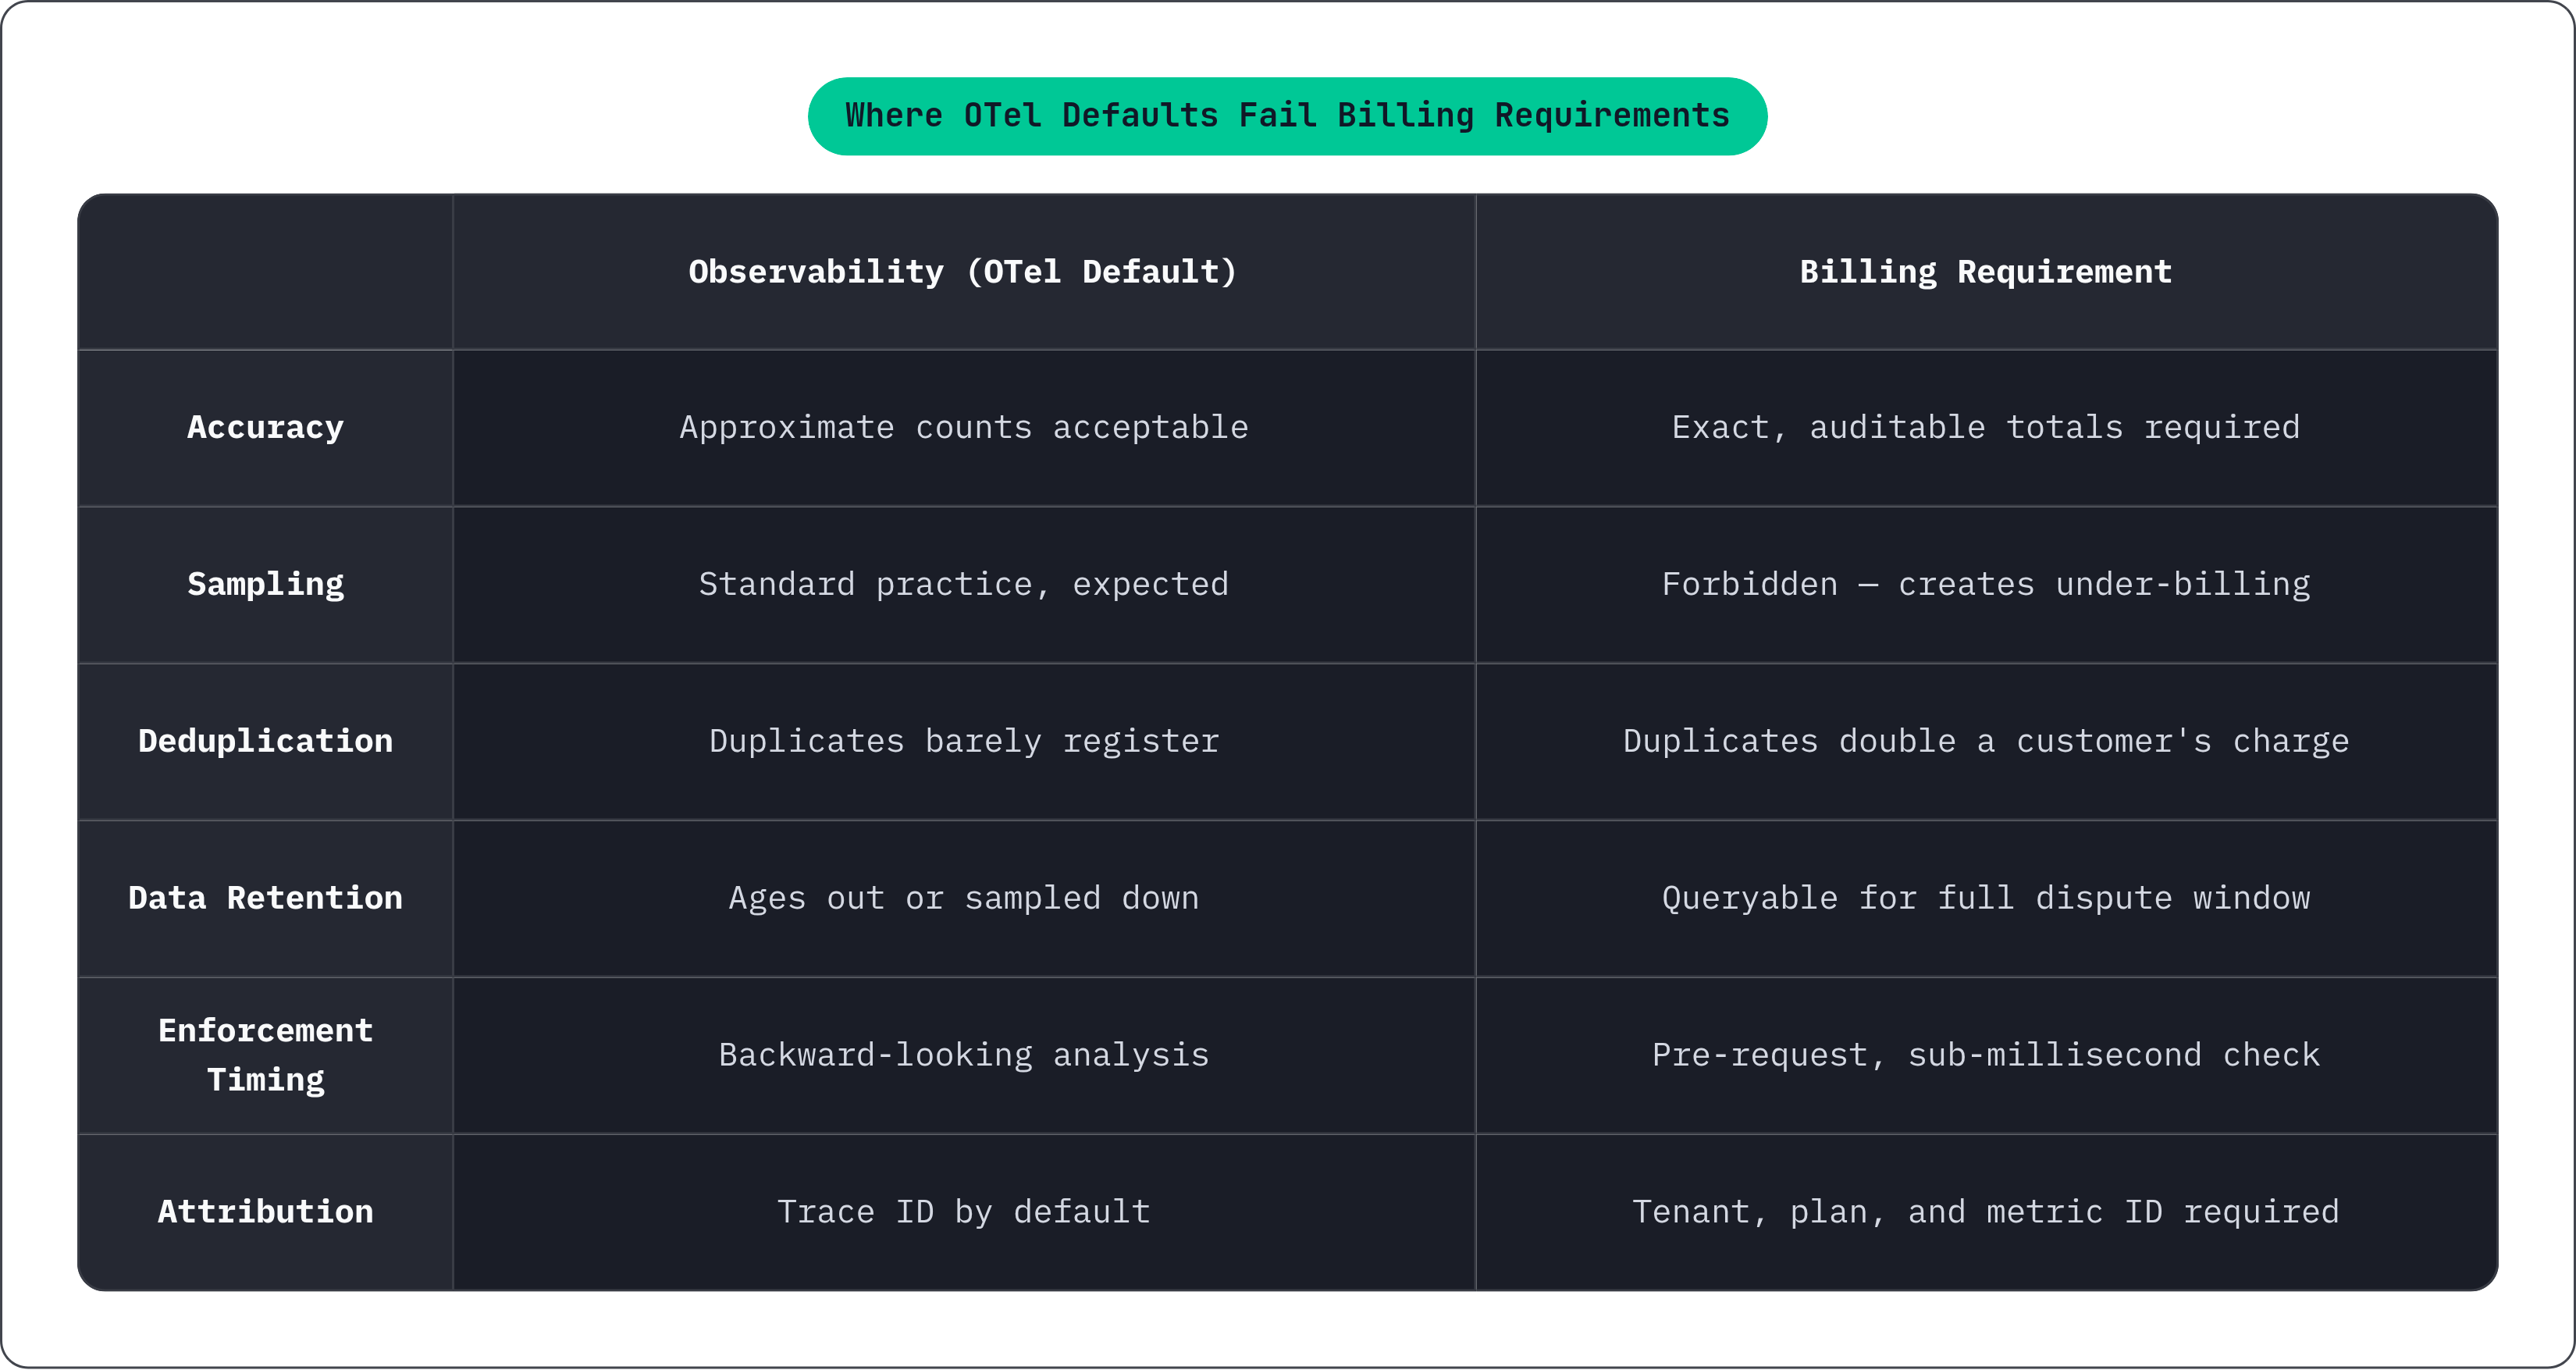
A few divergences are worth naming directly, because each one is a place default OTel configuration will quietly fail a billing use case, and each one took me a closer look at the spec than I expected to need before the failure mode made sense:
Accuracy is one. Observability backends accept approximate counts as a matter of course; billing needs an exact, auditable total that survives a customer dispute. Deduplication is another: a Collector restart or a retry storm can double-count events, which barely registers on a dashboard but doubles a customer's charge on an invoice. Retention differs too, since observability data typically ages out or gets sampled down, while billing data has to stay queryable and reconcilable for as long as a dispute might reasonably arise. Real-time enforcement is a fourth gap: observability looks backward, but a credit-balance check has to happen in milliseconds, before the next API call gets served, not after the fact. And attribution is the quiet one, the one easiest to miss until a dashboard full of spans turns out to have no tenant ID on any of them. A span carries a trace ID by default, not a tenant ID or plan ID or billable metric label, unless an engineer explicitly puts it there.
None of this is a flaw in OTel, since these are sound design choices for observability. They become failure modes only when a billing system leans on the same pipeline without adjusting for what that pipeline was built to tolerate.
The cardinality problem: why per-tenant metering breaks default OTel configuration
The OTel metrics SDK keeps a separate aggregation state in memory for every unique combination of attributes on a metric. That means cardinality, not request volume, is what drives memory cost, and adding a tenant ID, a user ID, or a raw URL path to a metric instrument without thinking it through can let memory use grow without bound as the number of unique combinations climbs.
The default cardinality limit is 2,000 unique attribute combinations per metric stream. A multi-tenant SaaS product with even a few thousand customers will blow past that limit fast, and once it does, the SDK starts silently dropping data rather than throwing an obvious error. You can raise the limit with a View, but raise it without a ceiling in mind and you've just traded a silent data-loss problem for an out-of-memory risk in the Collector pod. It's the kind of failure that doesn't show up until someone asks why a customer's invoice total looks lower than their dashboard usage, and by then the dropped events are gone.
The practical takeaway: per-tenant billing attributes can't live safely on the same metric stream you use for system-level observability, not without deliberate design up front. Two responses work. One is to run separate metric streams entirely, keeping observability low-cardinality and sampled while billing stays high-cardinality, unsampled, with its cardinality limits tuned on purpose rather than left at default. The other is to push billing-relevant attributes into log events or span attributes instead of metric labels, then do the aggregation work downstream in the metering layer itself. Neither approach is complicated, but both require someone to decide on it deliberately, because the default configuration will not make this decision for you; it will just drop data once you hit the ceiling and move on.
Scaling the Collector pipeline to handle billing-grade event volumes
A single Collector instance won't hold up under millions of spans per second, and this isn't a hypothetical edge case, it's a documented ceiling. Run the numbers at a fairly modest 10,000 spans per second with an average span size of 1 KB, and you land at roughly 25.9 TB of telemetry a month, before accounting for the fact that OpenTelemetry instrumentation tends to multiply total telemetry volume several times over compared to hand-rolled tracing.
The fix most teams land on is a two-tier Collector setup. Tier one is a gateway layer: raw ingestion, fan-out, initial routing, scaled horizontally as volume grows. Tier two handles the heavier lifting, enrichment, filtering, tail sampling, and export to whatever sits downstream, scaled for compute rather than raw throughput. Splitting the tiers this way means each can scale on its own terms, and it means a billing-critical stream can get dedicated processing capacity instead of competing with observability traffic for the same resources.
Durability is where billing pipelines need extra care that pure observability setups often skip. Turn on persistent queues through the file_storage extension so events survive a Collector restart instead of vanishing with it. Set GOMEMLIMIT to to a high percentage of the container's memory limit, so the process manages its own memory pressure instead of getting OOM-killed mid-batch and dropping whatever was in flight. Use a load-balancing exporter that routes consistently by trace ID or tenant ID, so related events land on the same processing Collector instead of scattering.
Tail sampling suits observability streams reasonably well, but billing streams call for a different standard entirely, and the routing has to happen before any sampling processor gets near the billing data, not after. Cost is part of this conversation too: one analysis from OneUptime in early 2026 put self-hosted storage at the volumes above around $1,156 a month at full retention, dropping to roughly $175 a month at 10% sampling. Billing data can't be sampled, which means the full-volume number is the real floor for any pipeline that has revenue riding on it. It's a number worth sitting with, because the instinct to sample for cost savings is exactly the instinct that produces an under-billed customer.
The canonical OTel-to-metering architecture: how the pipeline actually flows
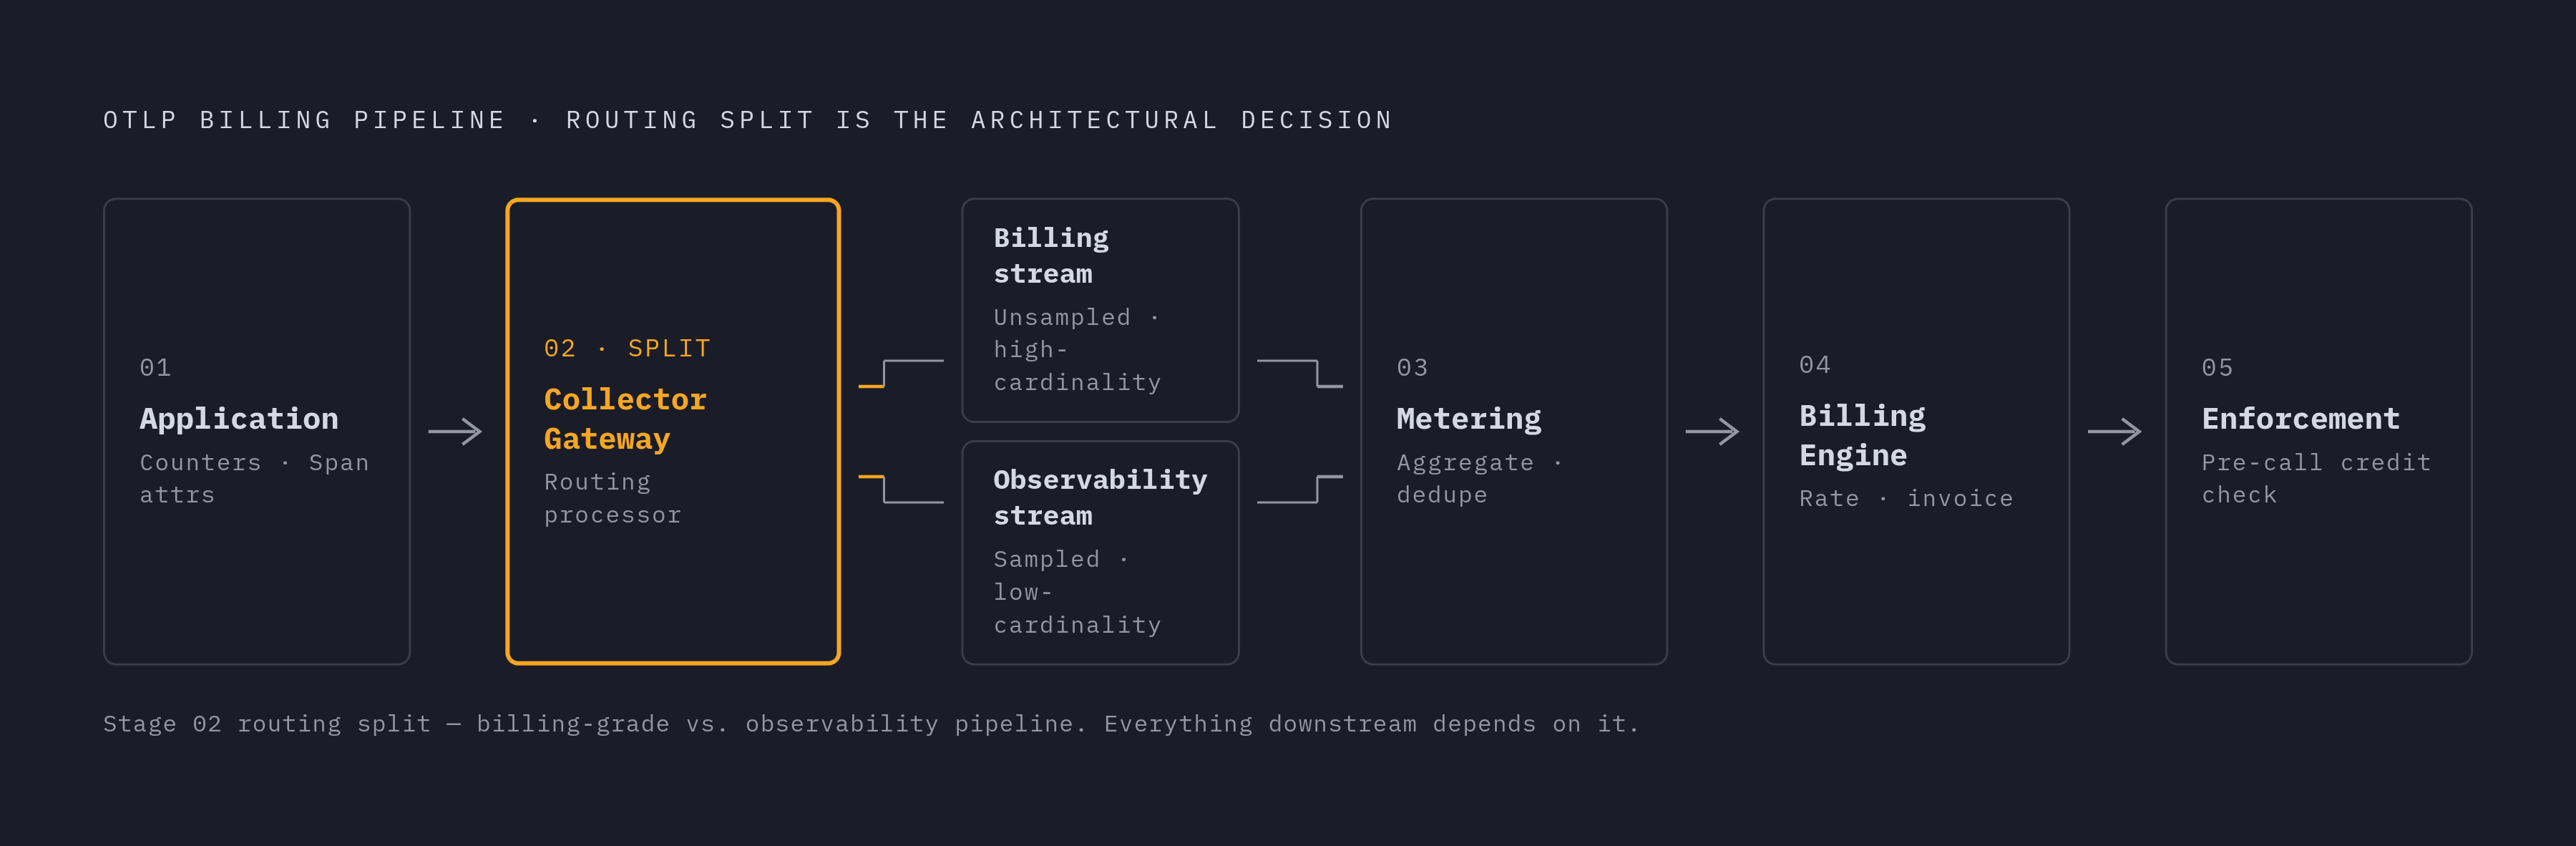
Picture it as five stages, each with a distinct job. The application instruments Counters for things like API calls, tokens, or GPU-seconds, and attaches span attributes for tenant ID, plan tier, and feature name right at the source, through the OTel SDK. Billing context gets attached at the point of instrumentation, not guessed at later.
From there, a Collector gateway receives the OTLP events and splits them: billing streams, unsampled and high-cardinality, go one way through a routing processor, and observability streams, sampled and low-cardinality, go another. The billing stream then lands in a purpose-built metering system, one designed around real-time aggregation, deduplication, and durable storage that supports both live balance checks and historical reconciliation when a customer disputes a charge.
The billing engine picks up from there, taking the aggregated, deduplicated usage totals and handling rating, invoice generation, and entitlement enforcement. The final stage is the enforcement loop, and it's the one teams most often get wrong: credit and entitlement checks have to happen before the API call gets served, not logged after the fact for a batch job to catch later. That requires the metering layer to expose a fast read path, not just a durable write path.
OTel's job stops at emitting and transporting the event. Everything after that, aggregation, deduplication, rating, enforcement, belongs to the metering and billing layer. Blur that line and you reintroduce every gap covered above.
Instrumenting for billing: what engineers must add that observability doesn't require
Attribute discipline comes first. Every billable event needs a tenant or customer ID, a billable metric name, and plan context riding along as OTel attributes, and none of that shows up by default in a typical observability setup built for debugging, not invoicing.
Picking the right instrument matters too. Token consumption, API calls, and data processed map naturally to a Counter, since they only accumulate, while concurrent seats or active connections need an UpDownCounter, because they rise and fall. Compute time and GPU-seconds could go either way, a Histogram if the distribution shape matters for pricing tiers, or a Counter if you only care about the total.
Idempotency keys are something OTel simply doesn't give you out of the box. Attach a unique event ID to every billable measurement so the metering layer downstream can catch and discard duplicates from retries. Timestamp precision deserves a second look too: OTel records event time by default, but billing needs wall-clock time at the moment of consumption, not the moment the event got exported, and those two can drift under load, usually in exactly the conditions — retries, backpressure, batch delays — where the drift matters most.
Separate billable signals from everything else at the point of instrumentation, not later at the Collector. Doing it early keeps downstream processing simpler and stops billing data from getting accidentally caught in a sampling rule meant for something else. And test the billing instrumentation on its own, apart from the observability instrumentation, since a broken counter on a dashboard is an annoyance, but a broken counter in billing is money walking out the door.
Hybrid and credit-based pricing create metering requirements that a basic OTel counter cannot satisfy
Hybrid pricing has become the dominant model, growing from 27% to 41% adoption in a single year according to Growth Unhinged's 2025 B2B Monetization report, while flat-fee subscriptions slid from 29% to 22% and seat-based pricing fell from 21% to 15% over the same stretch. That shift changes what the metering layer has to do, in ways a plain OTel Counter can't handle on its own.
Quota tracking is one example: knowing whether a customer is still within their included allowance or has crossed into overage requires comparing cumulative usage against a plan-level entitlement, a stateful question that a stateless counter has no way to answer. Credit burn is another; as a customer draws down a pre-purchased pool, something has to decrement a live balance and expose it for enforcement, not just keep appending to a running total. Multi-metric rating adds another layer of complexity, since a single hybrid plan might charge a flat rate for seats, a per-unit rate for tokens, and a tiered rate for storage, all reconciled onto one invoice. And soft and hard limits need configurable thresholds that can trigger a warning or a hard block before a customer's bill turns into a surprise.
Microsoft's Copilot pricing, a flat monthly subscription per user layered with credits for usage spikes, is a good reference point for how much reconciliation this creates: two separate billing tracks, potentially governed by different rating rules, that still have to land on one coherent invoice. Mixpanel's pricing change is worth mentioning too. When Mixpanel shifted its billable metric from raw events to tracked users, that reshaped the metering architecture underneath it, not just the pricing announcement on top, and the thing being counted changed, so instrumentation, aggregation, and rating rules all had to move together.
The lesson carries forward, and it's one that only becomes obvious after watching a pricing change ripple backward into instrumentation that nobody thought was in scope: build the metering architecture for the pricing model you expect to run 18 months out, not the one you're running today, because changing the billable metric later means touching instrumentation, pipeline, and billing rules all at once.
Where a purpose-built metering and billing platform picks up where OTel stops
OTel's contribution ends at a clean, standardized event stream arriving at the metering boundary. What happens on the other side of that boundary is what determines whether the whole system is actually billing-grade.
The metering and billing layer has to cover ground OTel was never meant to touch: deduplication with exactly-once guarantees, aggregation fast enough to support entitlement checks in the tens of milliseconds, credit balance tracking with real consistency guarantees, invoices with line items traceable back to raw events, plan and entitlement changes product teams can make without pulling in engineering, and revenue reconciliation clean enough that finance can close the books without exporting spreadsheets by hand.
Most software companies expect usage-based revenue to keep growing as a share of the business this year. Teams that stop at OTel instrumentation and put off building or buying the metering layer are going to run into the deduplication and cardinality problems described above under production load, at the worst possible time, rather than catching them in a test environment first.
Flexprice is one platform built specifically for this downstream role. It processes over 10 billion API requests a month at sub-50ms P99 latency, handles real-time credit balance tracking, and supports hybrid and credit-based pricing natively, including on-premises deployment for enterprise customers whose data residency rules rule out a cloud-only metering setup. The build-versus-buy question for this layer is a separate question from the one you already answered for instrumentation. OTel gave you the event stream, and what you do with it from here is a different decision entirely, one that actually determines whether your invoices are right.