Revenue Churn vs Usage Churn Distinctions in Metered Products
Metered products need separate metrics to catch customer decline before revenue follows.
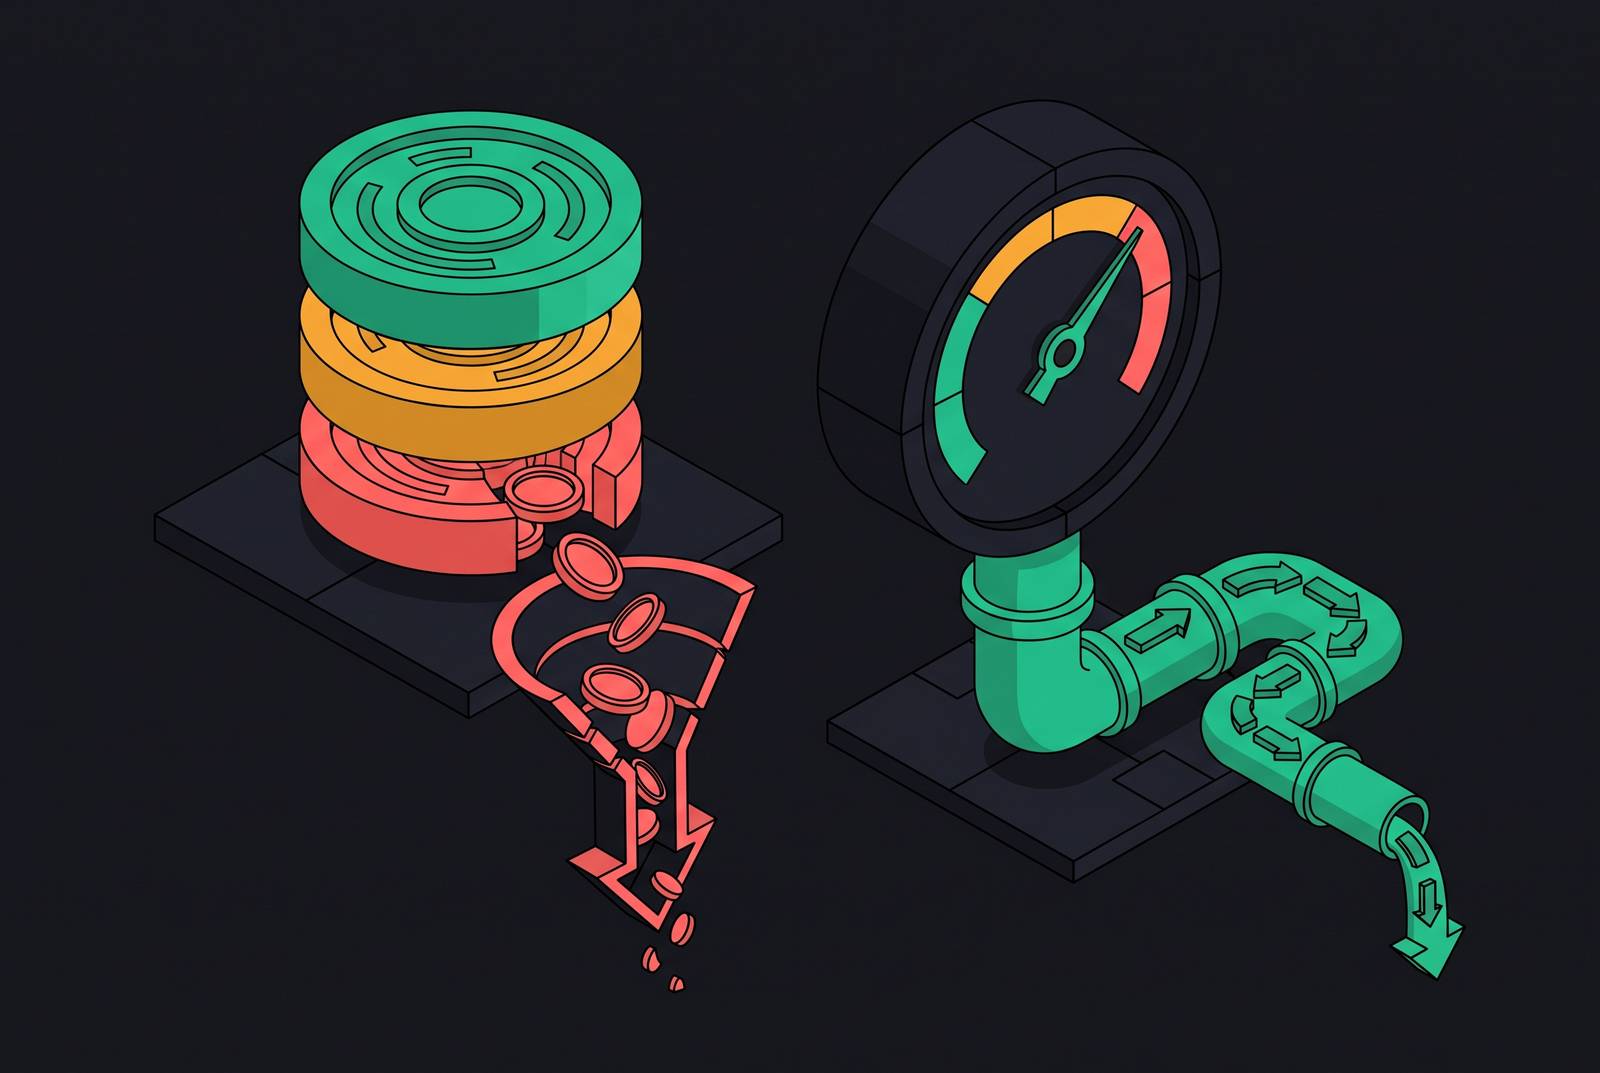
An AI product company looks at its dashboard and sees stable logo churn and an acceptable revenue churn number. Nothing on the screen suggests a problem. A cohort of customers has quietly cut its token consumption in half over three months, with no cancellations, no downgrades, no support tickets, and no line item that moves until the quarter closes, and this is what produces the dashboard's calm reading. That gap between what the dashboard shows and what is actually happening is the subject of this piece: revenue churn and usage churn measure different phenomena in metered products, and collapsing them into one number leaves the most dangerous signal unmeasured.
Revenue churn, properly defined, measures recurring revenue lost from cancellations and downgrades in a period. It is a financial outcome, and it includes contraction MRR, not just the revenue tied to departures. Usage churn sits in a different place entirely: a customer stays, keeps paying, and consumes progressively less of the product, producing no logo-churn event and only a muted revenue-churn signal until the decline compounds into something the invoice can no longer hide.
Seat-based SaaS does not have this problem in the same way, because the outcome there is largely binary. A customer either keeps the seat count or cancels, and one churn metric does most of the analytical work because there is no continuous middle ground to track. Metered products remove that binary. A customer can scale from heavy use down to near-zero consumption without a single cancellation event firing anywhere in the system, which makes a single churn metric structurally blind to a wide band of retention risk that seat-based businesses never have to account for.
What logo churn measures, and why metered pricing suppresses it
Logo churn is calculated simply: customers lost in a period divided by customers at the start of that period. It is a clean, auditable count, and it is the metric most businesses report first because it is the easiest to explain to a board.
In a subscription model, the moment a customer stops finding value, a hard choice appears: keep paying the same amount or cancel. That forcing function is what makes logo churn meaningful in seat-based products. Metered pricing removes the hard edge. A customer who finds the product less useful can simply use it less, with no cancellation required and no churn event fired anywhere in the billing system. The barrier to staying is lower in metered models, and that mechanically produces lower logo churn rates, a property of the pricing structure rather than evidence of retention health.
Low logo churn is still a sign that customers aren't actively leaving, and that much holds regardless of pricing model. But in a metered product, it says nothing about whether those same customers are getting more or less value over time, or whether their spend is trending toward zero. If you read a low logo-churn number as proof of a healthy retention motion, you've made a mistake specific to usage-based pricing, because the metric was never built to catch what usage-based pricing makes possible.
What revenue churn measures, and the contraction layer it can still hide
Revenue churn, also called gross MRR churn, measures recurring revenue lost from cancellations plus downgrades within a period. It captures contraction MRR, the revenue a business loses when customers stay but pay less, and logo churn ignores this completely because no account disappears.
Net Revenue Retention takes the analysis a step further by factoring in expansion revenue from accounts that are growing. A company can post a strong NRR number while a meaningful share of its customer base is quietly contracting, as long as a smaller number of expanding accounts offsets those losses in the aggregate. Gross Revenue Retention strips expansion out entirely and shows the raw retention of existing revenue, the floor below which NRR cannot fall without new bookings to prop it up. A widening gap between NRR and GRR is the early signature of a contraction problem that expansion revenue is currently masking.
In metered products, the mechanism behind that contraction is specific: a customer does not cancel and does not downgrade a plan tier, but simply sends fewer API calls or consumes fewer tokens, and the revenue line drifts downward without any discrete event appearing in the billing system. Finance teams that layer revenue-by-cohort analysis and usage-trend tracking on top of standard ARR and retention metrics are doing so because those standard metrics cannot surface this drift on their own. A team tracking revenue churn carefully can still be looking at the wrong cut of it, if the number in front of them is net rather than gross.
Usage churn: the third signal that sits between logo departure and revenue loss
Usage churn is a sustained decline in a customer's consumption that occurs without cancellation and without a billing-plan change. It is not a standard published metric the way logo churn and MRR churn are. It has to be constructed from event-level consumption data, because billing records alone do not contain enough resolution to show it.
You want to track a customer's usage volume in the current period against a rolling baseline for that specific account. A meaningful, sustained drop below that baseline, with no plan change and no cancellation attached to it, is a usage-churn indicator. Usage decline tends to precede revenue decline in metered products for a structural reason: usage happens continuously, while the revenue effect only materializes when the billing period closes. The gap between the usage signal and the invoice signal can run for weeks, sometimes an entire billing cycle, and during that gap the customer looks financially unremarkable.
That invisibility is not an accident of inattention. No cancellation fires a logo-churn event. If the customer sits on a minimum-commitment plan, the revenue line may not move at all in the short term. The contraction only becomes visible in MRR once the commitment period ends or usage falls below whatever included-usage floor the contract specifies. New Relic's shift to consumption-based pricing is one of the clearest documented pivots of this kind in the market, and the lesson from that transition carries directly here: usage data and billing data function as separate analytical layers, and treating them as one collapsed revenue view erases the earliest warning the business has.
How the three signals diverge
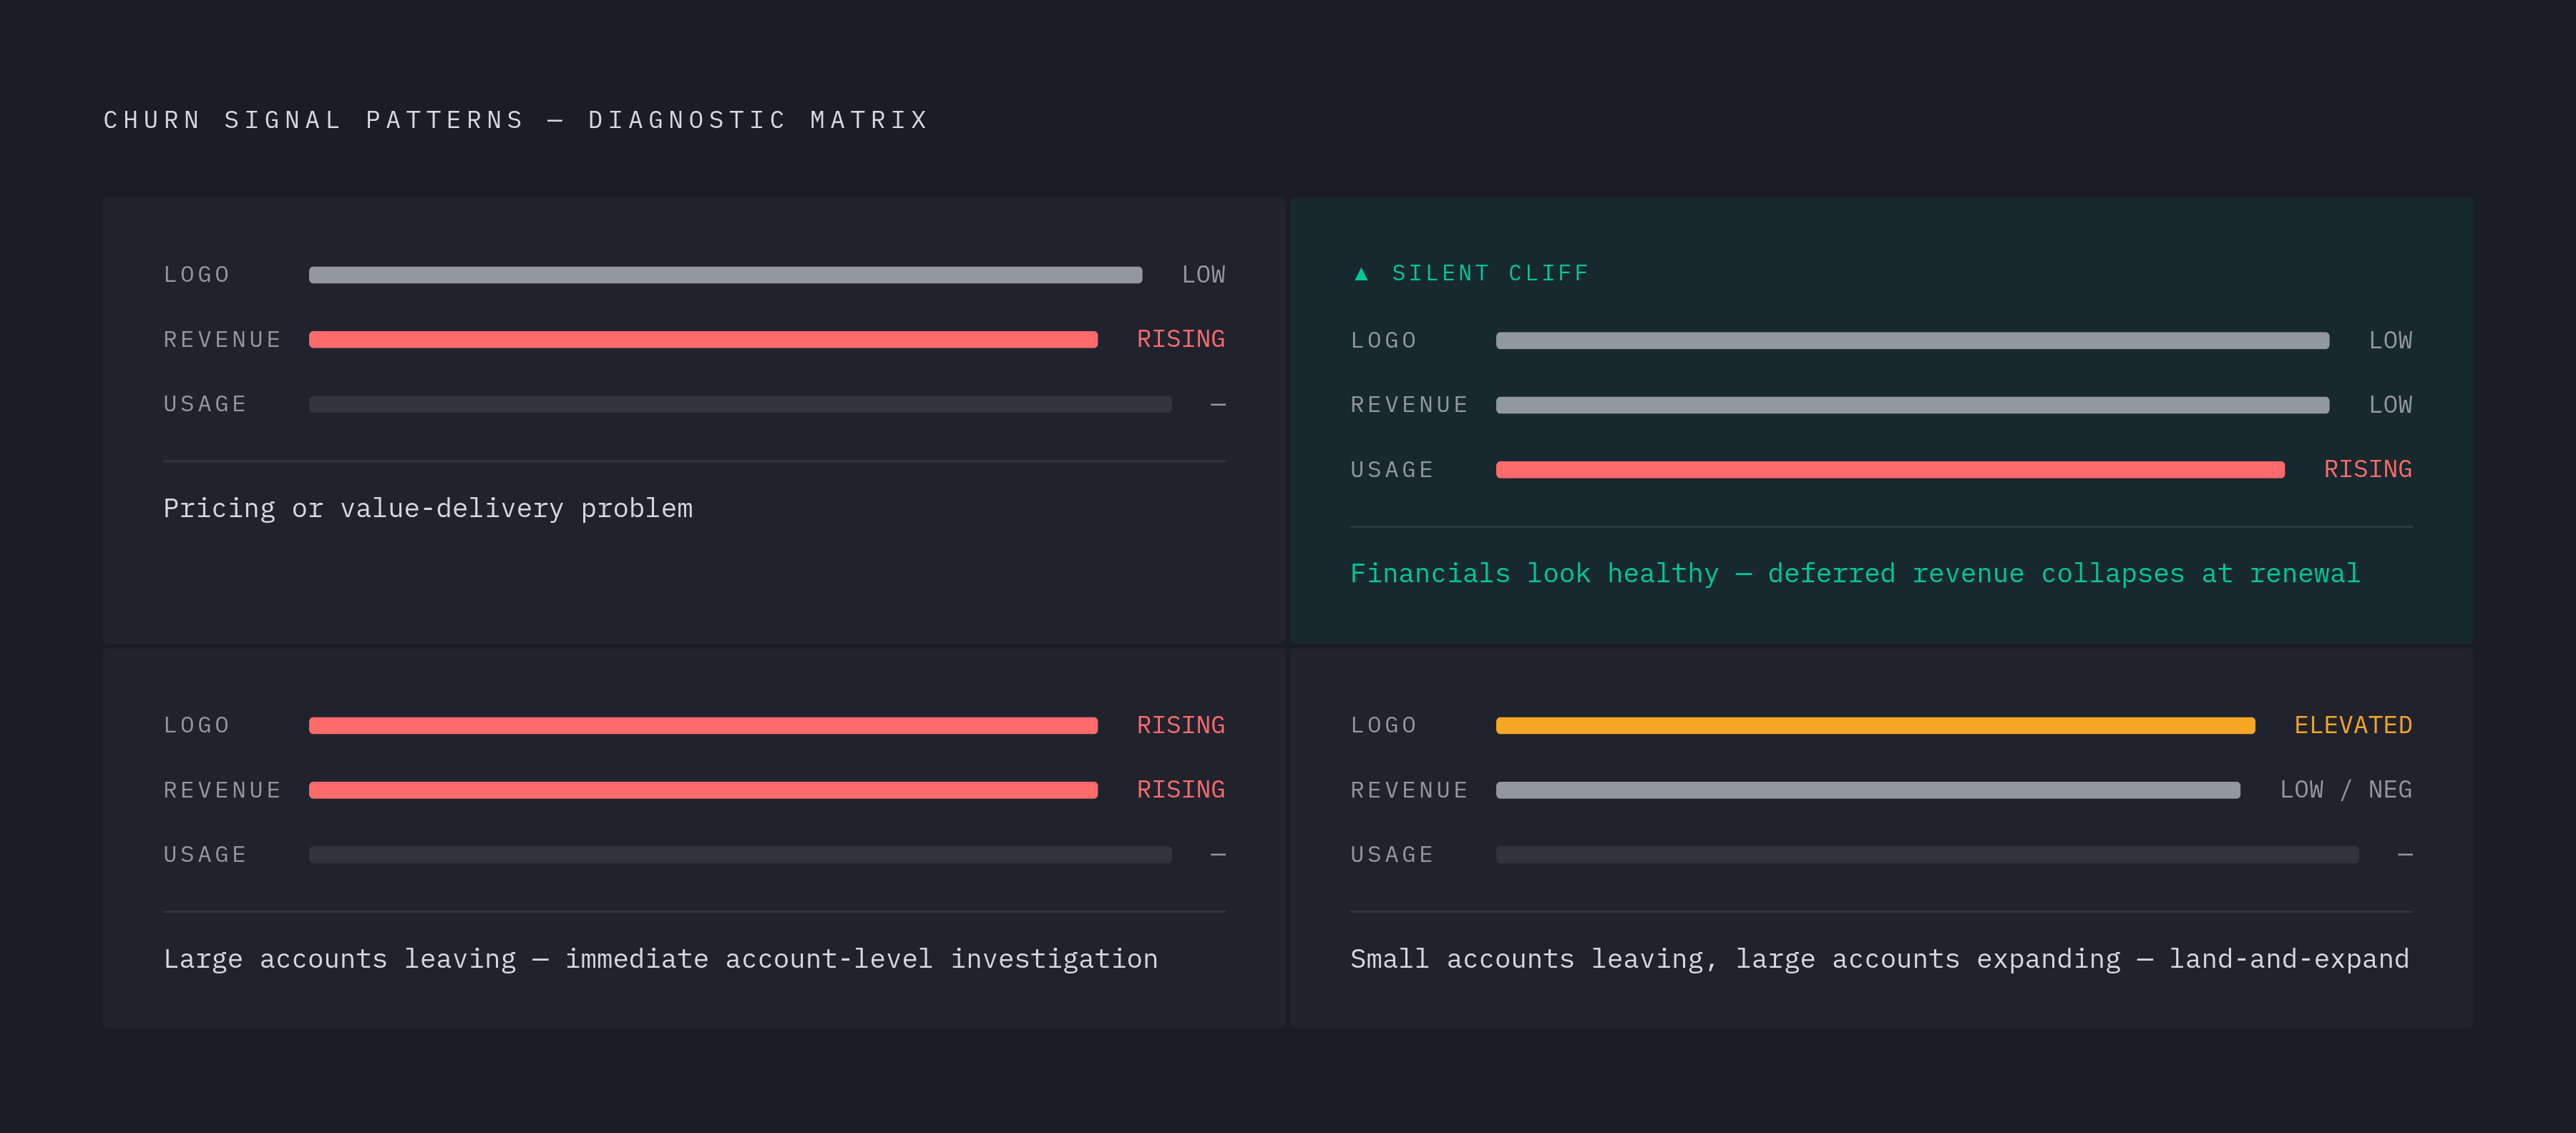
Tracking all three signals separately only pays off when the gaps between them get read as diagnosis. Each combination of movement across logo churn, revenue churn, and usage churn points to a different operational problem, and each one calls for a different response.
When logo churn is low and revenue churn is rising, customers are staying but downgrading or consuming less. So the product is retaining accounts while losing wallet share inside them, a pricing or value-delivery problem rather than an acquisition problem.
When logo churn is low, revenue churn is low, and usage churn is rising, the business is looking at its most dangerous configuration. Every financial metric reads healthy because consumption is falling in ways the invoice does not yet capture. The revenue effect is deferred, and this is the pattern that produces a sudden drop in MRR the moment commitment terms reset.
When logo churn is rising while revenue churn stays flat or even rises, the customers leaving are larger than average, the opposite of what a healthy churn pattern looks like, and it calls for immediate account-level investigation rather than a product-wide response.
When logo churn runs elevated but revenue churn stays low or negative on a net basis, small accounts are leaving while larger accounts expand, the classic land-and-expand pattern. Logo churn is noisy in this scenario, and revenue metrics are the ones that deserve attention.
Salesforce's iteration on Agentforce pricing shows how a pricing-model change can shift which of these patterns a team actually observes. The company moved from per-conversation pricing to a flexible credit model, then added per-user add-ons alongside a separate flat-fee, unlimited-use Agentic Enterprise License Agreement, which is a negotiated multi-year deal rather than a standard rate-card product, and each of those pricing structures changes what "contraction without cancellation" looks like on the ground.
Why usage churn is harder to detect without event-level data
Usage churn stays invisible in most metered-product stacks for a structural reason, not a negligent one. Billing infrastructure is built to capture revenue events, not consumption events, and those two event streams diverge in both timing and granularity.
Standard billing systems fire events at invoice time: period close, plan change, cancellation. The underlying consumption that produced the invoice gets aggregated and then discarded, or stored in a separate system that nobody checks against the revenue line. Detecting usage churn requires the event-level consumption record itself, the raw API calls, token counts, or GPU-minutes, timestamped per customer and comparable across periods.
Teams running separate metering and billing tools run into a specific version of this problem. The metering tool holds the event data. The billing tool holds the revenue data. The gap between the consumption trend and the invoice trend is invisible in both systems' native reporting, because neither system was built to look at the other's data. Real-time event ingestion, rather than batch processing, is the prerequisite for catching usage churn early: a system that processes consumption data in batch at period close cannot show the decline until the invoice already reflects it.
Platforms purpose-built to meter usage in real time, merging consumption tracking and billing into a single system, can show usage churn as it happens in consumption data, rather than waiting for invoice aggregation to reveal it after the fact. Flexprice is built around that architectural requirement specifically: event ingestion happens continuously, credit balance and usage metrics stay available in real time rather than only at billing close, and the same system that meters consumption also generates the invoice. That design choice makes the gap between the usage signal and the revenue signal a structural feature of the architecture, closed by design, rather than a reporting lag that teams have to work around after the fact.
Building a usage-churn signal from existing billing data
You don't need a new analytics platform to build a usage-churn signal. It requires treating consumption data as a first-class time series per account, and setting baselines at the account level from which any meaningful deviation triggers a review.
The first step is establishing an account-level consumption baseline: compute each customer's average usage over a trailing window and use that as the reference point. This has to happen per account rather than as a product-wide average, because usage volumes vary enormously by customer size and use case, and a product-wide average will smooth over exactly the contraction the signal is meant to catch.
The second step is defining a usage-churn threshold: a sustained decline of meaningful magnitude below baseline, for instance two consecutive periods significantly under the trailing average, with no corresponding plan downgrade or cancellation attached to it. That threshold needs calibration to the product's natural usage variance. High-variance products, where API consumption is sporadic by nature, need wider bands than low-variance products, or the threshold will fire constantly on noise.
The third step is separating genuine usage contraction from seasonal or episodic patterns. A one-period dip is noise. A multi-period trend below baseline, with no product or business explanation attached, is signal. Cohort-level analysis, grouping accounts by onboarding cohort, distinguishes a structural decline from a temporary dip that will self-correct.
The fourth step is attaching the usage signal to account health scoring. Usage trend becomes one input into a customer health score alongside engagement, support ticket volume, and payment history. If a declining usage trend pairs with otherwise healthy indicators, it is an early-stage risk worth watching. A declining usage trend paired with rising support tickets is a more urgent signal that calls for faster action.
None of this works without real-time visibility into usage. If teams and customers alike cannot see consumption in flight, before the invoice generates, they cannot act on the usage-churn signal early enough for it to matter. Teams running metered products need visibility into both the binary departure signal and the continuous consumption signal side by side: customer-facing usage dashboards and real-time consumption tracking, built into the billing infrastructure itself, make the gap between these two signals, and the silent contraction sitting inside that gap, visible immediately rather than only after the financial impact has compounded.
How the two churn signals should drive retention responses
Revenue churn and usage churn call for different interventions, because they sit at different stages of the same departure arc. Revenue churn signals a problem that has already landed on the invoice. Usage churn signals a value-delivery problem that has not yet reached the invoice.
A logo churn event calls for a post-mortem, a win-back attempt, and a review of acquisition quality, because by the time a logo churns in a metered product, something has gone wrong that the usage-churn signal should have flagged weeks or months earlier.
Revenue churn, specifically contraction MRR, calls for a pricing review, a plan-fit analysis, and proactive outreach from customer success. Contraction without cancellation often means the customer has hit a ceiling in the product's value for their current use case, or that a competitor is now handling part of the workload that used to run entirely on this product.
Usage churn at its early stage calls for a product engagement intervention: in-app guidance, usage-milestone nudges, and CSM outreach triggered directly by the health score. This is the intervention that prevents contraction MRR from ever materializing, and the response window for it is exactly the gap between the usage signal and the close of the billing period.
Usage churn is most reliably caught when a metering platform tracks consumption patterns in real time and surfaces them to finance and product teams without requiring manual cohort analysis every time someone wants to check. The earlier that drift becomes visible, the earlier a team can intervene before it turns into a revenue churn problem on the books.
Finance teams that separate the two signals forecast revenue more accurately, because they can model usage-churn cohorts as a deferred revenue-churn risk rather than treating current-period MRR as stable simply because no cancellations have occurred that month. A persistent usage-churn signal concentrated in one feature or workflow is a product signal as much as a retention signal, pointing to a roadmap gap rather than only a customer-success gap. And usage-churn patterns reveal something the invoice alone cannot: a customer scaling down to avoid overage charges is a pricing-alignment problem, while a customer scaling down because the product has stopped being useful to them is a product problem. Usage data distinguishes between those two causes. The invoice never does.